
MICROWAVE SSPA MANUFACTURERS (OEMS)
A wide range of companies, most of whom are headquartered in the U.S., supply various types of microwave SSPAs. Leading OEMs include overall market leader Stellant Systems, Kratos Defense, MACOM, CPI, Mercury Systems, MtronPTI, Qorvo, RFHIC, CAES (recently acquired by Honeywell) and Nanowave Technology. Stellant, Kratos, MACOM and CPI lead the pack, in that order.2,3
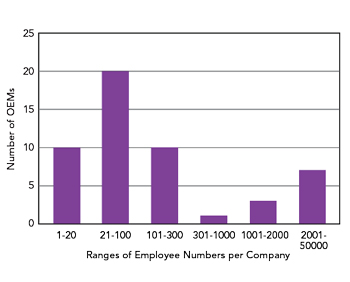
Figure 4 OEM count as a function of the representative number of employees.
There are 56 OEMs captured in the cited references and approximately three-quarters of all the OEMs employ between 1 and 300 people, so these are not large conglomerates. Many of these companies either specialize in the manufacturing of microwave SSPAs or those products form a significant part of their overall portfolios. The OEM distribution by the number of employees is shown in Figure 4. This chart uses typical numbers rather than the actual data.3
The distribution exhibited in Figure 4 is typical in that it tends to apply to almost any electronic assembly. The distribution indicates that most OEMs are SMEs employing no more than 300 people. The number of companies peaks in the 21 to 100 employee range before a dip follows this initial peaking trend. After this dip, a moderate increase is seen that applies to large and very large companies. For this class of companies that employ upwards of 1000 people, microwave SSPAs have always represented a relatively small part of their overall product portfolios.
In terms of location, the U.S. is home to the largest number of companies. There are 34 companies, 61 percent of the overall total, headquartered and having primary operations in the U.S. The majority of these companies, 18, are located in California. The U.K. occupies second place with five OEMs, although most are very small operations. South Korea takes third place with four OEMs headquartered in this country. The Gyeonggi-do high-tech defense-related cluster is particularly important in this regard.
In terms of the total available market, revenue from the MMIC or chipset will always be substantially lower than the value of the complete microwave SSPA and the system. The SSPA requires additional digital, processing and RF functions. It will be in a housing of some type with electrical and RF connections to the remainder of the system that contains an antenna, which is often the most expensive component. In addition, some cooling may be required, particularly for HPAs and VHPAs. This is likely to involve forced air cooling, but in some cases, like airborne jamming pods used in EW applications, natural air flow provides substantial in-flight cooling.
EW AND RADAR SYSTEM MARKET SHARE
Advances and developments at system suppliers are the primary driving features for module and subsystem manufacturers. Therefore, the dynamics associated with those systems have already been accounted for in the forecast data. The forecast reports rely heavily on primary and secondary research into the industry, the players and the technologies.
For each product category in the microwave SSPA family, the forecast lists total addressable market (TAM) data for the 2023 to 2030 forecast period. In this case, TAM addresses the merchant market, which is the portion of the market that is broadly addressed by distributors, agents, sales subsidiaries or directly from the OEM. The total market also includes the captive portion of the market, where system OEMs use internally manufactured devices. Estimating captive revenue is not feasible because it entails a knowledge of the internal transfer considerations at each company in the forecast. The simple relationship is: TAM = (total market) - (captive market).
The captive market can be significant, especially in the defense segment. For a number of technology, security and commercial reasons, defense contractors may prefer to retain control over electronics design, IP and manufacturing capabilities. Engalco-Research’s latest forecast for microwave SSPA TAM and the distribution between EW and radar applications is shown in Figure 5. It is important to note that China trails only the U.S. in terms of defense spending. However, the methodology of primary and secondary research, coupled with the current geopolitical situation, does not allow for a reliable and accurate estimation of activity in China.
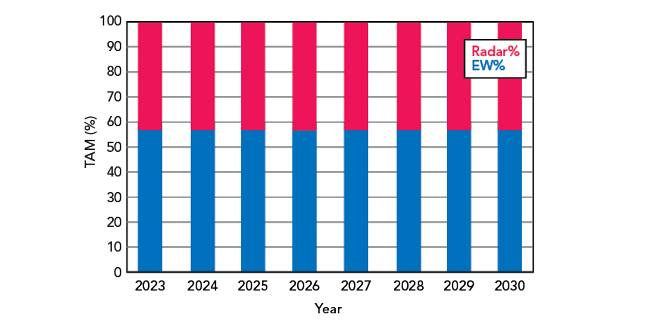
Figure 5 EW and radar systems TAM.
Figure 5 shows that microwave SSPA revenue for EW applications consistently exceeds the revenue for radar applications. Over the forecast period, the EW market share will see a slow but steady increase. The global TAM is expected to surpass $1 billion in 2026. We expect revenue in this market will experience year-over-year growth rates from 5 percent to just over 6 percent over the forecast period. A slight reduction in the growth rates is anticipated during the later years of the forecast.
Regionally, North America, mainly the U.S., always leads the markets. It is home to Tier 1 corporations like L3Harris, Northrop Grumman and Raytheon. Europe is the second-largest region with Tier 1 companies that include BAE Systems, Leonardo and Thales. Israel, because of geopolitical challenges, occupies the third spot in the forecast with suppliers like Elbit Systems, Israel Aerospace Industries and Rafael Advanced Defense Systems. Southeast Asia, driven mainly by Australia, India, Japan and Korea occupies fourth place over the forecast period.
MARKET SHARE BY PRODUCT CATEGORY AND FREQUENCY BAND
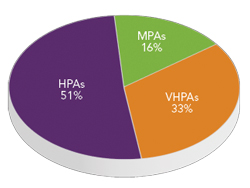
Figure 6 Microwave SSPA product categories by 2024 revenue.3
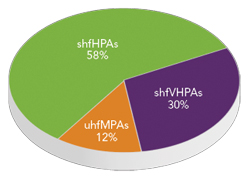
Figure 7 2024 TAM share by frequency band for microwave SSPAs.
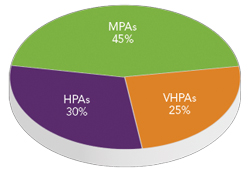
Figure 8 2024 microwave SSPA shipments power level.
Figure 6 shows the 2024 market share data for the three categories of microwave SSPAs defined earlier.3 From Figure 6, the importance of HPAs is evident. These PAs find applications in X-Band, (most notably) and Ku-Band systems for both EW and radar applications. The revenue from VHPAs is also substantial, mainly because of the relatively high unit prices of these amplifiers. It is important to observe the market shares given in Figure 6 are in terms of revenue, not units. The selling price of amplifiers tends to increase as the required output power increases. The average unit prices of the MPA category of PAs tend to be the lowest of all three categories. This contributes to this category having the smallest revenue in 2024, with a market share of 16 percent.
Segmentation by frequency band also shows some interesting results. Figure 7 shows the anticipated 2024 composite radar and EW revenue for the three microwave SSPA categories over two different frequency bands. Again, the HPA segment accounts for more than half of the total revenue. The SHF HPAs are mainly used in EW applications. The next largest segment is VHPAs in the SHF frequency range. These PAs are used in both radar and EW applications, with the radar share edging the EW share by a small margin. The UHF MPAs, once again, account for the smallest share. This opportunity is satisfied mainly by MMICs in QFN packages for EW applications. Since Figure 7 uses the broader SHF and UHF frequency designations, it is instructive to note that X-Band applications dominate within the SHF frequency range. In practice, these X-Band SSPAs may operate across a frequency band such as 8 to 10 GHz as opposed to the full 8 to 12 GHz band.
Figure 8 shows the microwave SSPA market share in terms of units. This data paints a much different picture. From a unit standpoint, the MPA category is the largest, with an estimated 2024 market share of 45 percent. This is in sharp contrast to the revenue market share profile from Figure 6 and it reflects the low price and high volume nature of these products that are often realized as MMICs. The HPA category is next from a volume standpoint, with an estimated 30 percent market share in 2024.
CONCLUSION
Microwave SSPA usage in military applications is well-established and these devices are vital to system performance. These products are steadily displacing TWTAs at higher power levels and we believe this trend will continue. The general trend toward systems operating at ever-decreasing RF power levels will also continue to favor solid-state amplifiers. With the well-established presence of several powerful and effective OEMs, it will be very difficult for any newcomers to penetrate these markets seriously. Newcomers will have to demonstrate a strong and highly competitive product or products to be able to make their presence felt in the highly demanding EW and military radar markets. Corporate expansion will be largely by acquisition rather than through organic growth.
References
- T. Edwards, “Technologies for RF Systems,” Artech House, Boston, Mass., 2018.
- T. Edwards, “Microwave SSPAs: Technologies & Industry” (an industrial monograph), Engalco-Research, August 2024.
- “Microwave Solid State Power Amplifiers (SSPAs) into Free-World EW and Radar Markets. Industry Structure & Market Forecasts to 2030,” Engalco-Research, September 2024.