

To confirm the measured versus modeled results, the bandpass filter was built and measured. Figure 6 shows the assembled filter including the same inductors and capacitors from the simulations. Figure 7 shows the results obtained from the planar EM/circuit co-simulation and the 3D EM simulation along with the measured data of the filter. The solid red trace represents the planar EM/circuit co-simulation results, while the solid blue trace corresponds to the 3D EM simulation results. The dashed traces represent the measured data of three filters.
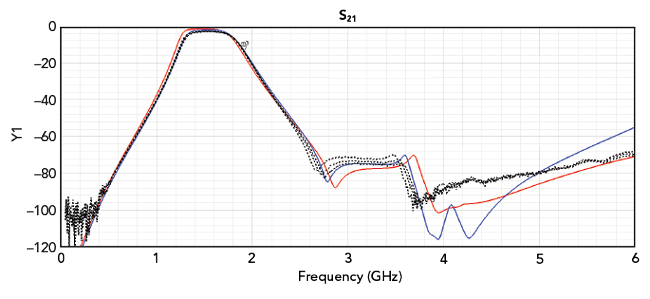
Figure 7 Simulated and measured S21 of the bandpass filter.
Figure 7 reveals that the planar EM/circuit co-simulation and 3D EM simulation produce similar results. A slight difference does exist, as the planar EM/circuit co-simulation produces a frequency response that is shifted roughly 40 MHz lower than that produced by the 3D EM simulation. Figure 7 also shows how the measured data follows the 3D EM simulation results more closely than the planar EM/circuit co-simulation results. Since both simulations produce similar results, coupling interactions do not appear to be significant. While the 3D EM simulation provides a good prediction of actual performance, the planar EM/circuit co-simulation still adequately predicts actual performance.
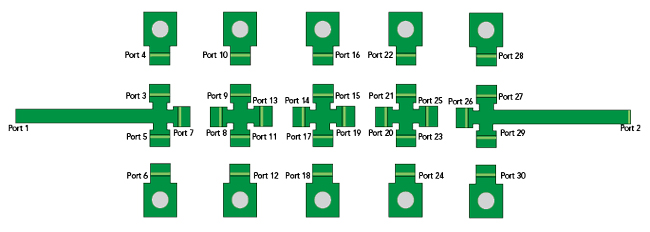
Figure 8 Bandpass filter layout with densely packed components.
Case Study 2: Filter With Densely Packed Components
The next case study analyzes a similar bandpass filter. The major difference between this filter and the one analyzed previously is that the components are located very close to each other in this design. Figure 8 shows the layout of this filter. In this case, the total length is only about 0.361 in. Note that the same 0.004 in. thick Rogers RO4350B substrate is used for this design. While this design offers the benefit of smaller size, it also comes with the challenge of greater coupling interactions between components.
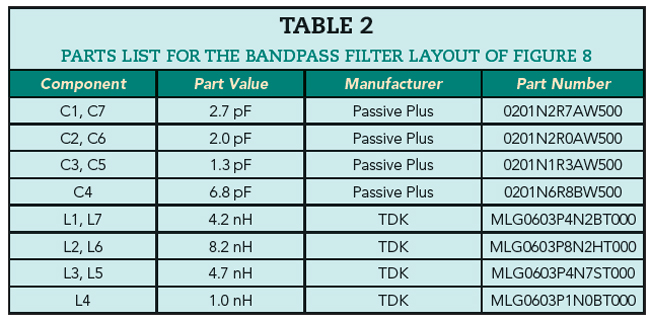
The target center frequency for this design is 1.46 GHz. Table 2 lists the part values of the inductors and capacitors. Again, the TDK MLG0603P series and the Passive Plus 0201N series are used for all inductors and capacitors, respectively.
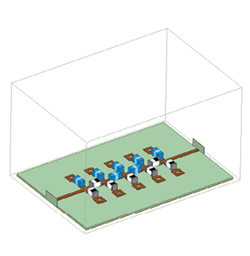
Figure 9 HFSS compact bandpass filter design with 3D Geometry Models and 3D Brick Models.
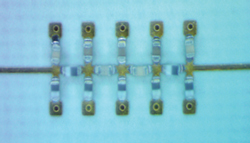
Figure 10 One of the (compact) bandpass filters that was built and measured.
The analysis for this case study is the same as the previous design example. Both a planar EM/circuit co-simulation and a 3D EM simulation are performed as described earlier. Figure 9 shows the bandpass filter in HFSS with 3D Geometry Models for the inductors and 3D Brick Models for the capacitors.
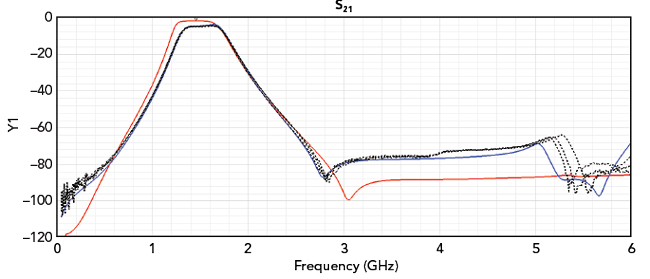
Figure 11 Simulated and measured S21 of the compact bandpass filter.
Figure 10 shows the assembled filter including the inductors and capacitors from the simulations. Figure 11 shows the simulated and measured S21 of this compact bandpass filter. Again, the solid red trace represents the planar EM/circuit co-simulation results, the solid blue trace corresponds to the 3D EM simulation results and the dashed traces represent the measured data of three filters. Figure 12 shows the simulated and measured S11 of the compact bandpass filter over a DC to 6 GHz frequency range and Figure 13 shows the simulated and measured S21 of the bandpass filter over the narrower, 0.5 to 3.5 GHz frequency band. In both figures, the solid red trace represents the planar EM/circuit co-simulation results, the solid blue trace corresponds to the 3D EM simulation results and the dashed traces represent measured data of three filters.
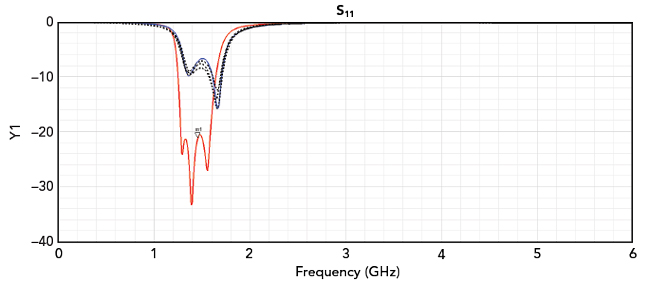
Figure 12 Simulated and measured S11 of the compact bandpass filter.
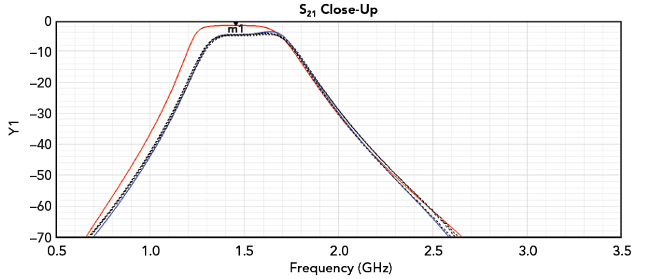
Figure 13 Narrower band simulated and measured S21 of the compact bandpass filter.
Initially, the targeted center frequency of this filter was set at 1.46 GHz. This goal is met considering only the planar EM/circuit co-simulation results. If this were the only verification result, the designer would conclude that the filter design met the requirements and no further action is needed. However, as already shown, the measured data is noticeably different than what the planar EM/circuit co-simulation is predicting. Specifically, in comparison to the planar EM/circuit co-simulation results, the measured data exhibits a reduced bandwidth and higher loss throughout much of the passband. At the desired center frequency of 1.46 GHz, indicated by the m1 marker in the plot, the measured data exhibits poor S11 performance.
This analysis demonstrates how a designer may be unpleasantly surprised when only relying on a planar EM/circuit co-simulation to predict the actual performance of a densely packed design such as this one. On a positive note, the 3D EM simulation results do agree very well with the measured data. These results demonstrate the need for and advantage of using 3D models in a 3D EM simulation for designs in which components are densely packed.
In practice, since the design goal is not being met, the filter would be tuned to achieve the desired performance. This task can be accomplished within the 3D co-simulation schematic from Figure 5. Recall how the 3D co-simulation schematic includes the 3D EM simulation data connected to the Microwave Global Models for the capacitors. Therefore, it is possible to tune the filter by simply adjusting the values of the capacitor models within the circuit schematic. Since the 3D EM simulation data is already incorporated into the schematic, there is no need to perform multiple time-consuming EM simulations.
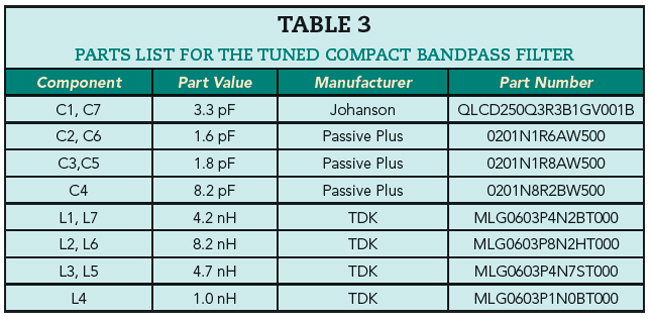
In this case, the filter can be tuned to achieve the desired performance by adjusting all the capacitor values. Table 3 lists the components used in this tuned version of the compact filter design. Figure 14 shows the simulated and measured S21 of the tuned compact bandpass filter. Figure 15 shows the simulated and measured S11 of the tuned compact bandpass filter over the DC to 6 GHz range and Figure 16 shows the simulated and measured S21 of the tuned bandpass filter over the narrower 0.5 to 3.5 GHz frequency band. Once again, the legend for the curves is the same. The solid red trace represents the planar EM/circuit co-simulation results, the solid blue trace corresponds to the 3D EM simulation results and the dashed traces represent measured data of three filters.
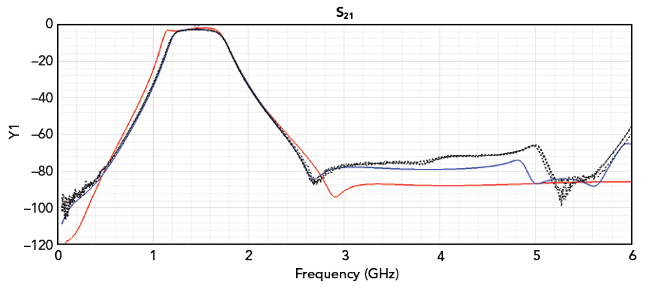
Figure 14 Simulated and measured S21 of the tuned compact bandpass filter.
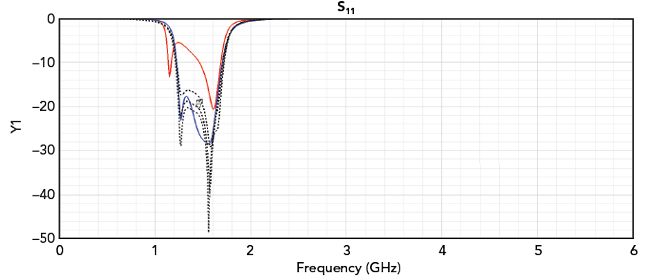
Figure 15 Simulated and measured S11 of the tuned compact bandpass filter.
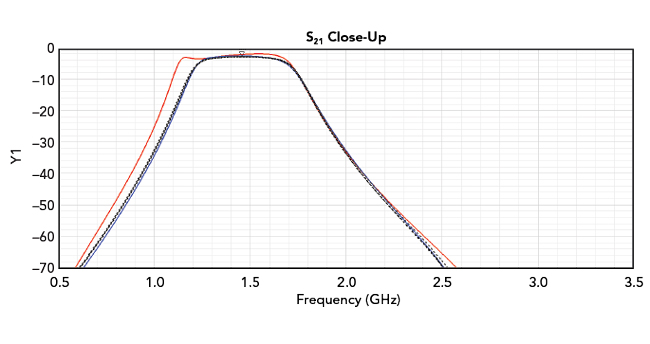
Figure 16 Narrower band simulated and measured S21 of the tuned compact bandpass filter.
The performance curves in Figures 14, 15 and 16 illustrate how the 3D EM simulation accurately predicts the actual performance. This time, the design goal is being achieved with the measured data showing a center frequency of 1.46 GHz. At 1.46 GHz, the measured S11 is lower than -20 dB. The planar EM/circuit co-simulation results again deviate from the measured data. Specifically, compared to the measured data, the planar EM/circuit co-simulation produces a wider frequency response with poor S11 at the low end of the passband.
CONCLUSION
The analysis presented here further emphasizes how 3D EM simulations with 3D models are effective for compact designs. Keep in mind that 3D models are not intended to completely replace equivalent-circuit models. Modelithics equivalent-circuit models like Microwave Global Models are very effective in terms of predicting actual performance when coupling interactions are not playing a major role. For densely packed designs where the effects of coupling may be present, 3D models would be the preferred choice.
References
- C. DeMartino, “Application Note 79: Filter Design Flow in Ansys Electronics Desktop with Modelithics Substrate Scalable Models,” Modelithics, Web: www.modelithics.com/Literature/AppNote.
- I. Bedford, E. Valentino and L. Dunleavy, “Application Note 63: Introduction to Modelithics 3D Models in HFSS,” Modelithics, Web: www.modelithics.com/Literature/AppNote.
- I. Bedford, “Application Note 78: Using 3D Brick Models™ for Full-wave EM/Circuit Model Co-simulation of MLCC Capacitors in Ansys HFSS,” Modelithics Web: www.modelithics.com/Literature/AppNote.
- C. DeMartino, “Streamline Filter Design with Ansys NuHertz FilterSolutions and Modelithics Models.” Modelithics, Blog Post, September 2022.