
Production testing of RF/microwave components and circuits is becoming a real challenge for many companies. Eager to get their latest developments to market, they must achieve performance that highlights the superiority of their products compared to the competition’s. On the other hand, customers are continuously requesting additional information on the datasheets. No longer satisfied with simple small-signal measurements and frequency swept S-parameters, they are asking for information related to their specific applications.
Depending on the component and application, the datasheet may include small-signal RF, frequency sweeps, DC sweeps, RF power sweeps, single and two tone distortion using CW, pulsed and modulated signals. Application engineers are trying their best to satisfy customers’ requests and run different measurement benches to compile all the data. Datasheet generation and formatting represent “60 to 70 percent of the total work done to take a new IC from prototype test to product launch,” according to the management of a major IC manufacturer.
AMCAD Engineering has addressed this challenge by developing innovative and advanced measurement software for efficient and accurate circuit testing. The platform is equally suited for S-parameters and CW, pulsed, two tone and modulated signals with DPD optimization. Requiring no programming skills to set up, it helps developers design and debug their products, considerably reducing time to market.
TEST BENCH SCHEMATIC
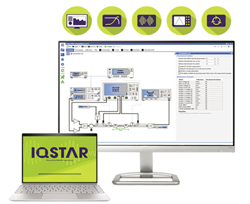
IQSTAR is turnkey software with a versatile and customizable schematic editor for building a test bench with available laboratory instruments and configuring it for an application (see Figure 1). Multiple configurations are possible: scalar, vector or a combination of scalar and vector.
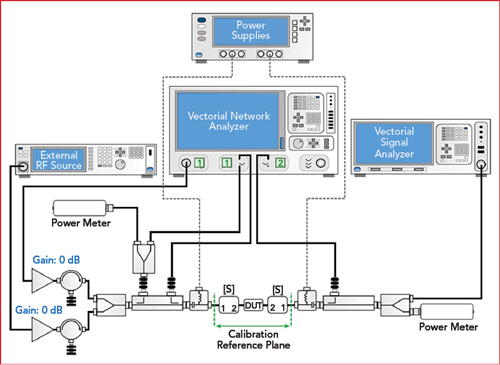
Figure 1 Example measurement test bench setup in IQSTAR.
Scalar measurements use power meters and a vector signal analyzer. The setup is basic and performs single tone power measurements, including input and output power, transmission efficiency, transmission gain and DC power. The measurements can be done with CW or pulsed signals or using a vector signal generator, modulated signals.
Vector measurements use the direct receiver access option of the vector network analyzer (VNA). The main advantages of this configuration are the large dynamic range of the receiver and measurement speed. This setup supports S-parameters and single and two tone power measurements. Using a- and b-waves in amplitude and phase, engineers get better insight of the characteristics of the device under test (DUT). In addition to the measurements possible with the scalar setup, the vector setup can measure input return loss, power gain, power-added efficiency, AM-to-PM distortion, calibrated harmonic power, intermodulation distortion and video bandwidth (VBW).
A third configuration combines scalar and vector, adding a vector signal generator and vector signal analyzer to the vector measurement configuration. To the previous measurement capabilities, this third configuration supports tests with modulated signals: ACPR, PAPR, CCDF, simultaneously in raw and linearized mode.
The software handles setup calibration, suggested to the user for each configuration. A calibration wizard guides the user through a step-by-step procedure.
MEASUREMENTS
IQSTAR has separate measurement tabs for S-parameters, single tone, two tone, VBW and modulated signals. Depending on the measurement setup and calibration file selected, the software will only activate the possible combinations. Measurement conditions are an important aspect of the configuration, particularly protecting the DUT by setting stop conditions. IQSTAR provides three power and frequency sweep modes:
- Power per frequency, with a complete power sweep for each frequency, saving the parameters for every measurement.
- Frequency per power, with a frequency sweep for each power level and saving the parameters for every measurement.
- Smart sweep using adaptive power steps, where the sweep uses a fast mode to find the compression point. Only the measured parameters at the compression point are saved.
IQSTAR includes a current stabilization feature that waits for the DUT to recover between consecutive power sweeps. This is useful when testing GaN designs, which may have trapping and self heating effects. The recovery time can be saved and used as a reference for technology evaluation and enhancement.
VBW measurements represent a challenging measurement task. IQSTAR handles this measurement efficiently, setting the amplitude of the tones according to the target third-order intermodulation distortion (IMD3) value set by the user. The software sweeps the spacing between the tones and adjusts the balance between them before recording the intermodulation - up to the ninth order. Taking advantage of the speed of VNA sweeps, this measurement takes just a few minutes.
IQSTAR includes a real-time configurable visualization tool, making it easy for test engineers to detect abnormal behavior of the DUT during measurement. Target tuning enables visually assessing if the DUT is reaching the target values by using color-coded data; the display shows a specified color for certain parameters when they are below the target. The history display compares the prior four measurements, which helps debug the DUT and see whether the performance is improving. Live measurements can be compared with references from simulation or previous measurements.
The sweep plan option creates a customized automated test flow, including sweeping the DUT biasing and temperature, as well as wafer mapping. The intuitive user interface makes it easy to create the test plan by dragging and dropping and recalling saved setups and configurations.
WHITEBOARD DATA VIEWER
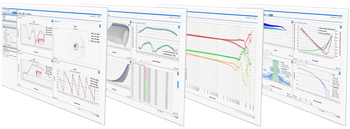
Figure 2 Whiteboard provides tools, interactive displays and multiple pages to view and analyze measurement data.
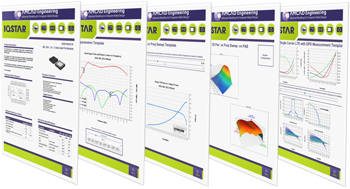
Figure 3 Pages of a Whiteboard workspace can be exported as PDFs, making data sheets much easier to create.
With all the measurements and test flows, data management is very complex, and the quantity of information can be overwhelming. Whiteboard enables the data to be managed and analyzed (see Figure 2). As the name indicates, Whiteboard is like a white board, providing the freedom to imagine how best to view and analyze data: 2D graphs, tables, 3D plots, labels, pictures, editable texts. In addition to the usual axis and data configuration, Whiteboard includes special features like sliders, filters, extractors and stackers - functions to create interactive displays that respond to adjustments in frequency, frequency range, compression point, the specific device on a wafer and more options. The Whiteboard has the capability to highlight the specifications of a component in the exact end user configuration. Multiple pages in the same workspace can be created to sort measurement results by types or devices.
Workspaces can be saved and templates created, defined by device type or technology, for example. Dragging and dropping measurement files in the data editor will automatically update the template, and all graphs will reflect the new values. Plots and graphs can be exported as images and the pages of the workspace exported as PDFs, making measurement reports and data sheets much easier to create (see Figure 3).
AMCAD Engineering
Limoges, France
www.amcad-engineering.com