

In the mixing process, mixers generate more than the desired signals at their output. Other, undesired signals at integer multiples of the input and LO frequencies appear at all of the mixer’s ports as well. These parasitic signals can, in turn, mix with each other and exit the output port of the mixer into the rest of the signal chain. These undesired output signals are referred to as spurs. If these spurs are high enough in power, they can lead to many issues in radio design, such as pollution of neighboring channels in a transmitter, loss of sensitivity in a receiver, or distortion of the desired signal itself. Depending on system requirements, there are multiple ways of dealing with these problematic signals. Careful frequency planning and filtering can help to drastically reduce the number of spurs, but they’re always going to be there. Therefore, it’s important for a systems designer to accurately measure the spurious levels at the output of a mixer in order to determine how best to handle them.
Measuring mixer spurs isn’t simple. It is often possible to be tricked into believing that a “measured” signal is coming from the mixer in question, when in fact, it’s actually an artifact of an improper test setup. Fortunately, there are ways to mitigate these testing issues and assure that what you’re seeing emanates from the mixer alone. Figure 1 shows the correct test setup for measuring mixer spurious content. The bandpass filters, as well as the attenuator pads, are critical for minimizing the test setup’s contribution to the spurs measured at the spectrum analyzer.
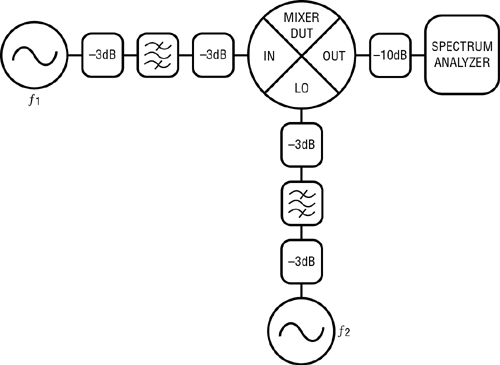
Figure 1: Proper test setup for measuring mixer spurs
Spectrum analyzers can produce significant internal distortion products when overdriven. The internal receiver chain can go into compression when too much power is applied, causing all non‑linear spurious products to grow at an accelerated rate with respect to the main input signal, artificially increasing the spur power measured. Spectrum analyzers are typically designed to operate at their best with about ‑30dBm to ‑40dBm at their input. In order to meet this power level, internal attenuation, external attenuation, or a combination of both should be used to limit the power presented to the instrument. One test to check whether a spur is measuring correctly is to increase the internal attenuation setting of the spectrum analyzer and note any changes in the spur’s power level. If the spur’s level changes by more than about 0.5dB, then it is likely that the spectrum analyzer was being overdriven, and therefore reading a higher spur level than is actually present. A good starting point for input attenuation is about 20dB-30dB total, internal and/or external. Figures 2 through 5 demonstrate a CW tone measurement with increasing amounts of input attenuation to the spectrum analyzer. As the attenuation level increases, the measured power level drops, indicating that the instrument was originally being overdriven.
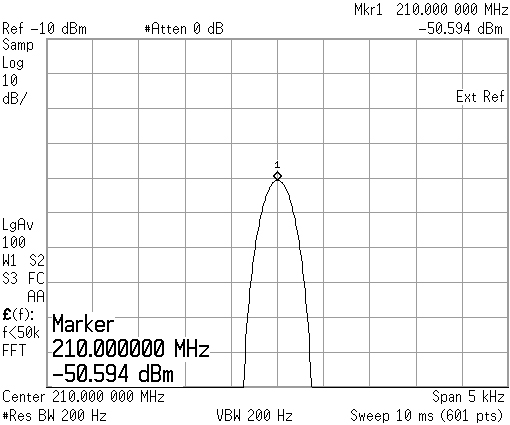
Figure 2: 3rd Harmonic of a 0dBm CW 70MHz tone with 0dB Spectrum Analyzer Input Attenuation

Figure 3: 3rd Harmonic of a 0dBm CW 70MHz tone with 10dB Spectrum Analyzer Input Attenuation

Figure 4: 3rd Harmonic of a 0dBm CW 70MHz tone with 20dB Spectrum Analyzer Input Attenuation
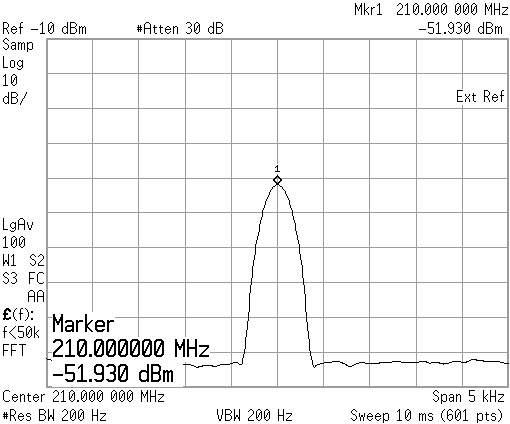
Figure 5: 3rd Harmonic of a 0dBm CW 70MHz tone with 30dB Spectrum Analyzer Input Attenuation
After seeing that overdriving the spectrum analyzer can result in incorrect spur measurements, you may decide to simply drive the instrument with a low power level to avoid the issue entirely. If 30dB of attenuation is good, 100dB must be better. After all, the spectrum analyzer normalizes the signals when the internal attenuator is changed. Unfortunately, this isn’t feasible if you want to see the spurs of interest. For every dB of input attenuation used (internal or external, it is the same), the noise floor of the instrument comes up 1dB, reducing the dynamic range of the instrument, which may hide some of the very spurs you’re trying to measure. Note that the noise floor is higher, and therefore visible in Figure 5 compared to Figures 2-4, even though the scales are identical. Also, higher order spurious products do not change in power linearly with the desired output signals. Instead, they change power in multiples of the input power change. Second order products (2*IN x 1*LO, 2*IN x 2*LO, 2*IN x 3*LO, etc.) will change 2dB/dB, 3rd order products (3*IN x 1*LO, 3*IN x 2*LO, 3*IN x 3*LO, etc.) will change 3dB/dB and so on. For example, if you decrease your input signal power by 2dB, the spur at 5*IN x 2*LO will decrease by 10dB, while the spur at 2*IN x 1*LO will decrease by 4dB. Because of this, putting too low a signal power level into the spectrum analyzer simply forces all of the low power spurs you’re trying to measure into the noise floor of the instrument.
Another common source of inaccurate spur measurements is a lack of input signal filtering. Using filters for the input signals to attenuate any signal generator harmonic content is critical for accurate spur level measurements. Even a lab quality signal generator will only have harmonic suppression levels in the -25dBc to -50dBc range. Some spur levels at the output of a Linear Technology mixer will be below -70dBc, so using the signal generator without a filter isn’t good enough. For this reason, filters with at least 30dB to 50dB of harmonic suppression should be used. Figure 6 shows the output spectrum of a 100MHz CW tone from a Keysight E8257C signal generator. Note the power levels of the fundamental signal’s harmonics. These harmonics relative levels should remain consistent over various main tone power levels.
If you suspect that your input signals may be causing your spurs to be higher than expected, it’s best to check the spur’s behavior with regard to input signal level. If the spur is higher order, yet doesn’t respond to signal level changes with the appropriate slope (2dB/dB, 3dB/dB, etc.), then it’s likely that the input sources aren’t clean enough.
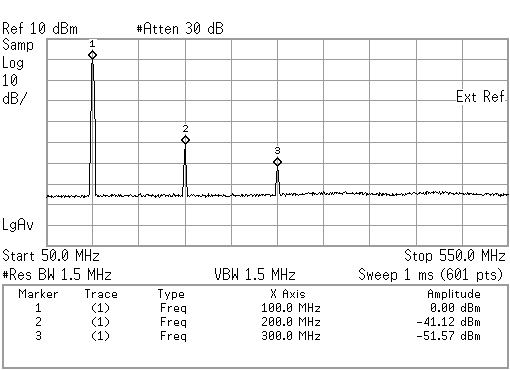
Figure 6: Harmonic spurs of a 100MHz CW tone from a Keysight E8257C signal generator
As shown, measuring mixer spurs isn’t always simple, but with some small tweaks to the test setup, better results are easily attainable. Setting the input attenuator and using proper filtering techniques for signal sources will yield far more accurate and repeatable measurements.