
With the proliferation of wireless technologies now used in commercial, aerospace and defense (A&D) applications, interference problems are becoming more common and more severe. To mitigate these issues, many A&D systems — and some early 5G designs — are moving to higher frequencies, including the millimeter wave band. Related design enhancements include the use of narrow radar pulses and highly encrypted communication signals. While these techniques and technologies can fend off the effects of externally generated interference, they make field troubleshooting more difficult. As a result, new tools and measurement technologies are needed to effectively maintain deployed systems. One such tool is real-time spectrum analysis (RTSA), which is especially effective for interference hunting and signal monitoring. When these high speed, gap free measurements are added to a handheld spectrum analyzer or combination analyzer, field personnel can use a single instrument to detect, locate and fix interference problems.
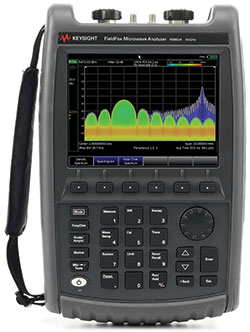
To provide these capabilities up to Ka-Band, Keysight is now offering RTSA as an optional capability for many of its FieldFox handheld RF and microwave analyzers. These offer a maximum real-time bandwidth of 10 MHz at frequency ranges up to 50 GHz (N995xA and N996xA models).
THE MEANING OF REAL-TIME ANALYSIS
The phrase “real-time analysis” and the implied capabilities often mean different things to different people. Fortunately, a consistent core concept can be defined as follows: in a spectrum or signal analyzer with a digital intermediate frequency (IF) section, real-time operation is a state in which all signal samples are processed for some sort of measurement result without any gaps between time acquisitions (see Figure 1). Achieving a wider real-time analysis bandwidth requires higher sampling and processing rates. Thus, for a given computational capability, there will be a maximum bandwidth above which the signal processing hardware cannot keep up with the sample stream. A closely related term is real-time bandwidth (RTBW), which is the widest measurement span at which the analyzer can maintain real-time operation.
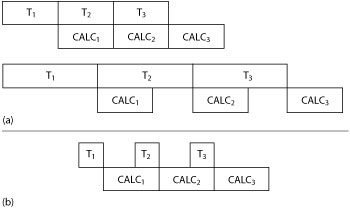
Figure 1 Real-time operation occurs when the instrument’s calculation speed is fast enough to ensure gap-free analysis of sampled data, including computation, averaging and display updates (a). If gaps occur between the time acquisitions (b), the operation is not real-time.
As signal environments become more complex, it is increasingly important to represent a large amount of measurement data on a single screen. This is essential for RTSAs that generate thousands of spectra per second, many more than can be discerned by the human eye. As an example, FieldFox with RTSA can produce >120,000 spectra per second, yet the average human eye can detect only 30 per second. Therefore, to take advantage of real-time results, each display update needs to represent about 4000 × 30 results in a useful way. The most informative displays are created by compiling statistics and displaying how often a particular measurement value occurs (e.g., a specific amplitude at a specific frequency). One example is the density display, which is a spectrum measurement enhanced to show frequency of occurrence and can be considered a backwards-looking version of probability. These displays are coded using color or trace intensity, and a persistence function can be added to focus attention on more recent events as older data fades away (see Figure 2). Trace data such as the most recent single display update, or an average, can also be overlaid as a trace similar to a traditional spectrum measurement. This approach allows field personnel to see and focus on infrequent events or transients, then separate them from other behavior. By changing the persistence and color weighting, specific behaviors can be highlighted.
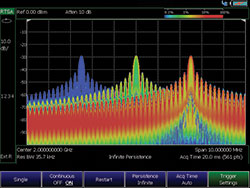
Figure 2 Density display with user-selected persistence time helps to convey the behavior of multiple signals occupying the same frequency channel.
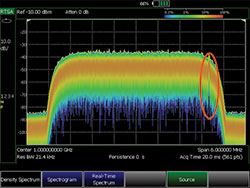
Figure 3 A narrowband RF signal (red oval) “hiding” beneath a W-CDMA signal.
RTSA also can reveal signals within signals. In a highly dynamic environment, it can be difficult to see small signals with low duty cycles when the frequency content overlaps with signals that are wider, larger or more frequent. Fortunately, adjusting the persistence time can enhance the small differences that reveal elusive signals. Any situation in which signals can be separated by frequency of occurrence is a candidate for this approach (see Figure 3).
CARRYING PRECISION INTO THE FIELD
Keysight’s FieldFox handheld analyzers deliver precise microwave and millimeter wave measurements and possess key attributes that support routine maintenance, in-depth troubleshooting, and virtually anything in between:
- Frequency coverage from 5 kHz to a maximum of 50 GHz
- Multiple capabilities, including cable and antenna tester (CAT), spectrum analyzer, RTSA, vector network analyzer (VNA), power meter, independent signal source, frequency counter and GPS receiver
- Rugged design meeting MIL PRF 28800 F class 2, type tested for IP 53 and MIL STD 810G 511.5 process 1 (explosive environment)
- Field ready at 7.1 lb (3.2 kg) and a battery life up to four hours.
A built-in interference analyzer includes the ability to record and playback captured signals. FieldFox can also perform pulse measurements using its spectrum-analyzer mode and a USB peak power sensor.
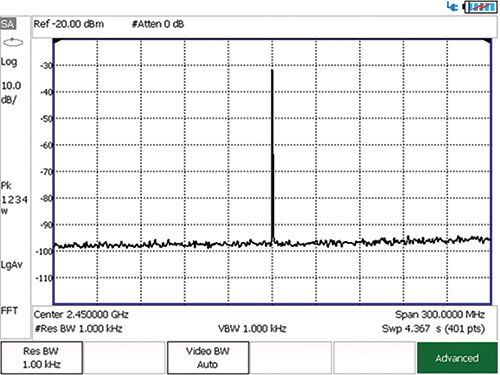
Figure 4 Measuring a 2.45 GHz signal in RTSA mode shows the noise floor, absence of spurs and usable dynamic range.

Figure 5 The spectrogram (top) uses a color-coded overhead view of frequency spectra vs. time (y-axis) that reveals pulses with various widths. The individual spectrum display (bottom) shows a specific instant.
FieldFox key RTSA specifications are exceptional in field testing. For most over-the-air (OTA) applications, the maximum RTBW of 10 MHz is more than sufficient, because external interference typically occurs within a much narrower band. Another crucial spec is the probability of intercept (POI), which is the minimum duration for a signal of interest to be detected with 100 percent probability and measured with the same amplitude accuracy as when observing a CW signal. A FieldFox with RTSA has POI performance < 12.2 µs and can detect pulses as narrow as 22 ns.
When hunting for interference in the field, dynamic range and spurious performance are also important. Usable dynamic range is a function of front-end gain compression, preamplifier performance and the noise floor of the analyzer’s receiver. Together, these factors determine the lowest detectable power levels. Figure 4 shows the performance of the FieldFox analyzers with RTSA: the noise floor is at -93 dBm, no spurs are visible and the usable dynamic range is approximately 67 dB at a 2.45 GHz center frequency and 300 MHz span. In general, FieldFox can see signals down to -150 dBm with the preamplifier activated and at narrow resolution bandwidth (RBW) settings.
ENHANCING REAL WORLD MEASUREMENTS
FieldFox capabilities lend themselves to a variety of real world measurement situations. The characterization of radar signals in the field provides a good example. With a pulsed radar system, the analyzer must provide a variety of RBW and span settings that enable measurements of characteristics such as pulse repetition frequency (PRF), pulse width, duty cycle and peak power. For OTA testing, precise triggering functions are needed to capture specific pulses of interest. With a FieldFox running in RTSA mode, the user simply enters the center frequency, and the analyzer will immediately capture the pulsed signal. Pulse width and peak power can easily be measured, and the user can adjust the frequency span to zoom in or out. Measuring duty cycle or PRF requires a simple change to zero-span mode. The spectrogram display makes it possible to view an entire pulse train over a period of time, and an individual frequency spectrum (i.e., a single line in the spectrogram) can be selected for viewing in a separate trace (see Figure 5). This type of measurement is not possible with a swept or “snapshot” spectrum analyzer.
With today’s multiplicity of wireless technologies, advanced measurement tools are needed to effectively maintain deployed A&D and commercial systems. In a millimeter wave FieldFox handheld spectrum or combination analyzer, RTSA is especially effective for interference hunting and signal monitoring. Field personnel can use this single instrument to detect, locate and fix interference problems in scenarios that range from radar testing and LTE analysis to signal monitoring and IED jamming.
Keysight Technologies
Santa Rosa, Calif.
www.keysight.com/find/fieldfox