
Reflection Stability
The basic setup is to terminate the free end of the measurement cable with a calibration standard load. This puts the measurement cable in the reference position and uses the VNA trace math, or an external PC, to normalize the measured return loss. Again, the cable is bent and moved to a different position as needed.
Bending Conditions
Rosenberger measurement cables are specially designed for use with VNAs and are specified for 90 degrees of bending and relaxation (original position after 3x 90 degrees of bending). This is tested in four different directions. The 90-degree bending test represents a typical change in cable orientation between a two port VNA calibration and measurement. Bending procedures used at Rosenberger are the following:
1 × 90-degree bending test The measurement cable is bent into nine positions and measured: straight, up, straight, down, straight, left, straight, right and straight. The evaluation starts with the change from one position to the next, 1 to 2, 2 to 3 and so on. Example results are shown in Figures 2 through 4.
3 × 90-degree relaxation test The measurement cable is bent into seven positions and measured: straight, up, straight, up, straight, up and straight. Measurements are taken and results are calculated for position 1 and 7. This is repeated for the directions down, left and right.
MEASUREMENT EXAMPLE
Transmission and reflection stability are evaluated for a measurement cable after more than three years of lab use. The solid green and green dashed traces in Figure 2 show bending from the straight position into the down position and back again to the straight position. The amount of phase change for both sequences is the same but in opposite directions, as expected. The blue curves show that the up-direction sequences behave similarly but at about half the magnitude.
Bending to the right position corresponds to the “natural bending” of the measurement cable and shows the smallest phase changes. After production, coaxial cables typically exhibit a “natural bending.” The coaxial measurement cable has a non-straight form. Measurement cables often show best stability when bent in this direction. For the most accurate VNA measurement, bending in the direction with best stability should be considered.
Figure 3 can be interpreted similarly, although the bending direction with the worst stability is different.
Return loss stability (see Figure 4) is well within specification limits. The bending direction with the worst return loss stability corresponds to the one with the worst phase stability.
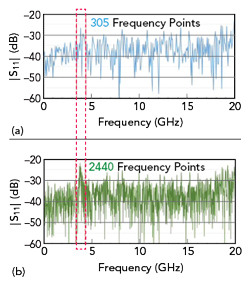
Figure 5 |S11| comparison between 305 (a) and 2440 (b) frequency samples.
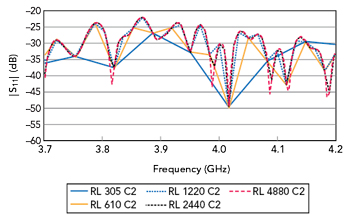
Figure 6 |S11| comparison among 305, 610, 1220, 2440 and 4880 samples from 3.7 to 4.2 GHz.
MEASUREMENT POINTS
The number of the measurement points is often not included in illustrations, test plots or other marketing material; although, without a proper minimum number of measurement points spikes cannot be detected. Spikes are a result of a repeated discontinuities along the cable. In VDI/VDE/DGQ/DKD 2622 Part 198 and IEC 60966-1 Chapter 8.1.29, there are formulas to calculate the minimum number of points to detect spikes (see Figures 5 and 6). The measurement of spikes is described in these documents as follows: “cable assemblies might have narrow return loss spikes. For continuous network analyzer systems, the sweep rate shall be low enough and for digital network analyzer systems, the number of measurement points shall be high enough for resolving eventual return loss spikes.” Figure 6 compares measurements with 305, 610, 1220, 2440 and 4880 measurement points. Spikes are visible between 3.7 and 4.2 GHz. Using the formula:

εr ≅ 1.45 results in a wavelength of 65.6 mm.
A half wavelength is 65.6 mm divided by 2 = 32.8 mm. The cable braid in this example is 12 sections with eight strands each. The distance between one full rotation of a section is 28 mm. The velocity factor of the cable results in an electrical length of about 33.7 mm. The reason for the spike is likely a too strongly wrapped cable section (see Figure 7).
The minimum number of measurement points is:
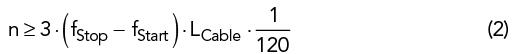
where:
n = number of measuring points in the frequency range fStart to fStop
fStart = lowest frequency in the measurement range, in MHz
fStop = highest frequency in the measurement range, in MHz
LCable = physical length of the RF measuring cable, in meters (ignores the relative permittivity εr)
The velocity factor is determined by:
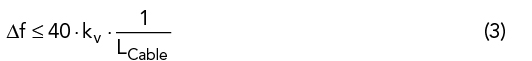
Where Δf is the maximum increment of frequency, in MHz, LCable is the physical length of the RF measuring cable in meters and kv is the velocity factor.
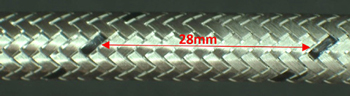
Figure 7 Tightly wrapped cable section is the possible cause of a return loss spike.
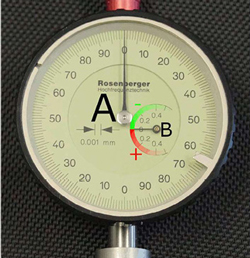
Figure 8 Connector gauge.
CARE AND HANDLING OF CABLE ASSEMBLIES
Connector mating is a significant factor influencing performance. Damaged connectors can also permanently damage equipment. Use of a gauge is recommended to check the references of the connector before each measurement (see Figure 8). Center pin protrusion is critical; if it is too large it can cause damage and if it is too short it can result in poor electrical performance. A proper torque wrench is necessary for repeatedly reliable contact without damage. For storage, protection from solar radiation, temperature changes and high humidity should be avoided. A proper storage environment and the use of protective caps will ensure longevity.
Some customers may be familiar with our measurement protocols. They provide instructions on care and handling, which include important factors to minimize mechanical stress like adhering to minimum bending radii and avoiding pinching, pulling twisting and free floating.
CONCLUSION
Cables used for VNA measurements contribute significantly to accuracy and repeatability. RF characteristics like reflection, attenuation and phase length are critical factors. Test cables should be measured on a regular basis and replaced when they fail to meet specifications. Proper care and handling will be rewarded with higher accuracy and repeatability.
References
- Keysight, “2-Port and 4-Port PNA Network Analyzer,” Web: https://www.keysight.com/de/de/assets/9018-04171/technical-specifications/9018-04171.pdf.
- Maury Microwave, “StabilityPlus™ Microwave/RF Cable Assemblies,” Web: https://www.maurymw.com/pdf/datasheets/2Z-009.pdf.
- Radiall, “Low Loss High Frequency Flexible Cable Assemblies (SHF Range),” Web: https://www.radiall.com/products/rf-cable-assemblies/low-loss-high-frequency-flexible-cable-assembly-shf-range.html.
- GORE, “VNA Microwave/RF Test Assemblies,” Web: https://www.gore.com/products/gore-vna-microwave-rf-test-assemblies.
- Huber + Suhner, “Sucoflex® 500,” Web: https://www.hubersuhner.com/de/products/radio-frequency/cables-cable-assemblies/cables-cable-assemblies/high-performance-microwave-cable-assemblies/sucoflex-500.
- Rohde & Schwarz, “R&S®ZV-Z9x and R&S®ZV-Z19x Test Port Cables,” Web: https://cdn.rohde-schwarz.com/pws/dl_downloads/dl_common_library/dl_brochures_and_datasheets/pdf_1/ZV-Z9x_ZV-Z19x_dat-sw_en.pdf.
- Rosenberger, “Test Port Cables & Adaptors,” Web: https://www.rosenberger.com/de/produkt/test-port-cable-adaptors/.
- “VDI/VDE/DGQ/DKD 2622 Part 19: Calibration of Measuring Equipment for Electrical Quantities Characterization of HF Measurement Cables,” June 2015.
- “IEC 60966-1: 2019-02, Radio Frequency and Coaxial Cable Assemblies – Part 1: Generic Specification – General Requirements and Test Methods,” Edition 3, February 2019.