Millimeter wave (mmWave) frequencies have traditionally been dedicated to military applications, with some commercial use for point-to-point microwave links. Octave bandwidth waveguide was the preferred transmission line as mmWave capable coaxial cables and connectors were not available. That has changed during the past decade, with technology improvements in semiconductors, components, cables and connectors. As mmWave frequencies are now being used for commercial and consumer electronics, design engineers must be aware of the issues encountered using coax cables within a test system. Reducing test equipment size and using fewer interconnections will yield improved measurement accuracy.
GROWING MARKETS
Several market segments are adopting mmWave frequencies, each with its own design and test considerations:
5G — The demand for mobile data spectrum keeps growing with the increasing number of smartphone users and new applications that require very high data rates. Recognizing this, in July 2016, the U.S. FCC opened up nearly 11 GHz of mmWave spectrum: 27.5 to 28.35 GHz, 37 to 38.6 GHz, 38.6 to 40 GHz and 64 to 71 GHz. While 5G is still evolving, it appears the initial use will be for last-mile residential service. Longer term, mobile devices and base stations will have beamforming antennas to compensate for the higher path losses at mmWave frequencies, enabling these applications to become more common.
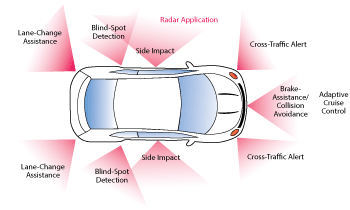
Figure 1 Automotive radar sensor applications.
Automotive Radar — A cornerstone in the ability to achieve self-driving vehicles is the ability to detect and avoid obstacles (see Figure 1). To support the array of sensors needed for automotive radar, mmWave components are rapidly being developed. Current automotive radar uses the 24, 77 and 79 GHz frequency bands.
60 GHz Wi-Fi (WiGig) — Consumer Wi-Fi applications have expanded beyond what is available from the IEEE’s popular 802.11ac wireless local-area network (LAN) standard. 802.11ad taps the 58 to 64 GHz spectrum, which has long been available for unlicensed services and was recently expanded to 71 GHz (FCC Part 15). Examples of applications are high speed wireless multimedia transmission, including uncompressed HDTV and virtually instantaneous music and images.
Point-to-Point Links — For telecommunications, both fiber and microwave backhaul are commonly used. While fiber is preferred for backhaul because of its higher speed capacity, microwave and mmWave backhaul are widely used in many regions, with mmWave links supporting LTE 4G cellular services in high density areas. They will continue to be deployed, as they are attractive for smaller bases stations such as picocells, microcells and metrocells. The traditional microwave and mmWave backhaul bands are 6, 11, 18, 23 and 38 GHz. Unlicensed 60 GHz backhaul equipment is inexpensive but offers limited range due to high oxygen absorption. Some 80 GHz backhaul units are now available, with the most popular mmWave frequency at E-Band, which covers 71 to 76 GHz, 81 to 86 GHz and 92 to 95 GHz.
Security and Defense — Radar and satellite communication are the main military applications for mmWave systems, with security systems more recent. Advanced imaging technology that leverages mmWave allows detection of metallic and nonmetallic threats, including weapons and explosives, without physical contact. If you have boarded a plane in recent years, you are probably familiar with these systems, now common at U.S. airports.
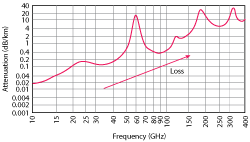
Figure 2 Atmospheric propagation loss vs. frequency.
mmWAVE CHALLENGES
As discussed, the advancement of mmWave technology has opened the door for numerous applications. Higher frequency transmission, however, comes with challenges such as higher propagation loss, measurement repeatability and field testing.
The loss of a signal propagating at RF and microwave frequencies is proportional to the frequency (f) and distance (d):

At mmWave frequencies, there is additional attenuation from components of the Earth’s atmosphere, such as oxygen. Figure 2 shows how propagation loss varies with frequency. Attenuation is particularly pronounced at 60 GHz from oxygen absorption. Using this property, regulators have chosen 60 GHz for unlicensed use to minimize co-channel interference. However, the additional loss presents a testing challenge. Test equipment needs higher output power or improved sensitivity for accurate measurements at these bands.
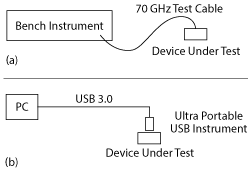
Figure 3 Using a benchtop instrument for measurements at mmWave frequencies will likely suffer from high cable losses (a). Using a small, USB-controlled instrument usually allows the instrument to be placed much closer to the device under test (b).
At 70 GHz, the diameter of the coaxial center connector is just 0.5 mm. A center pin diameter is the same size. Connector dimensions are approaching the limits of machine shops, and scratches and dust particles on the connector interface affect the impedance match at mmWave frequencies. mmWave connections require significantly more care than at lower frequencies. Connector interfaces should be inspected with a microscope and cleaned before each use. Connectors should be tightened with a torque wrench to the proper specification (i.e., 8 lbs-in maximum).
OVERCOMING mmWAVE TEST CHALLENGES
Spectrum analyzers are often used to measure the path loss of a proposed wireless link. The setup comprises a test source with antenna and spectrum analyzer with antenna, placed at realistic locations. At lower frequencies, a bench instrument on a cart with the antenna elevated on a pole and fed with a coaxial cable is used. At mmWave frequencies, a similar approach with a long cable run results in significant loss. For example, at 70 GHz, a
3 m cable has more than 20 dB loss, reducing measurement range and accuracy. Also, the loss and phase characteristics of cables vary with temperature, which adds to the uncertainty. To address this, a portable spectrum analyzer can be connected directly to the antenna and elevated above the control PC, using a USB extender cable to interface with the analyzer (see Figures 3 and 4).
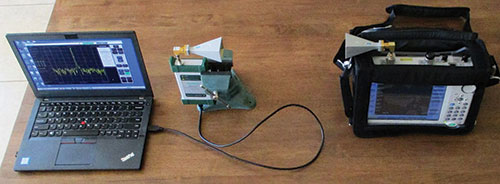
Figure 4 Link measurement setup at 28 GHz. A 0 dBm, battery-powered portable source drives the transmit antenna, with a handheld spectrum analyzer connected directly to the receiving antenna.
Reducing the number of connections in a test system reduces measurement error and the possible points of failure, including dust or dirt affecting the return loss of a connection. It also minimizes the chance for imperfections that cause test system impedance to vary from 50 Ω. Each connection in the system (male to female connector pair) will add uncertainty, and mmWave connectors and cables are particularly sensitive. They must be handled carefully to ensure accurate measurements.
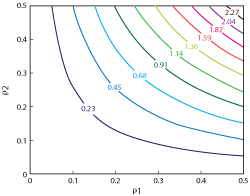
Figure 5 Mismatch uncertainty (±dB) resulting from two interfaces with reflection coefficients ρ1 and ρ2.
Power meter and spectrum analyzer measurements are “scalar,” meaning the phase of the signal is unknown. Mismatch at the sensor or analyzer will cause a portion of the signal to be reflected back toward the source. Mismatch at the source will cause this reflection to return towards the sensor or analyzer. As the test frequency changes, the mismatch voltages sequentially sum and cancel, introducing amplitude ripple to the results. The measured values can be either above or below the value achieved with ideal 50 Ω components in a 50 Ω system.
The mismatch uncertainty can be calculated from the voltage reflection coefficient, ρ, of each interface. For two interfaces with reflection coefficients ρ1 and ρ2 , the positive and negative uncertainties, u+ and u−, in dB are calculated using the expressions
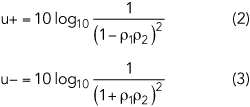
ρ can be measured with a vector network analyzer (VNA). A family of uncertainty curves generated from these equations is shown in Figure 5. As an example, if a 70 GHz signal generator with 2:1 SWR (ρ =1/3) is connected to a power sensor or spectrum analyzer having a 2:1 SWR, a 0 dBm power measurement could have worst-case measurement uncertainty range from +0.92 to ‐1.02 dB. As the number of connections in a system increases, these errors will compound.

Figure 6 A precision test cable connecting a measurement instrument to the device being tested will add uncertainty from the cable loss and reflections at the cable interconnects.
Precision, low loss cables can improve system performance. A 2 ft. precision test cable will typically cost more than $1,000 and will still add uncertainty from mismatch and insertion loss (see Figure 6). The issue of cable loss becomes more complicated if multiple cables are used in a system. For example, assume one cable has 5 dB of insertion loss at 30 GHz and 8 dB at 70 GHz. A second cable, from the same manufacturer, has 5 dB insertion loss at 30 GHz but 10 dB at 70 GHz. This scenario, which is not uncommon, makes it difficult to determine the net loss. To properly characterize and remove the impact of the cables, a network analyzer can characterize each cable to discover the net loss at each measurement frequency. This, however, can be complicated, time consuming and costly. The only way to simply and completely remove the impact of cables is to remove them and directly measure the device under test (DUT). In this example, connecting the spectrum analyzer directly to the DUT would improve the sensitivity by 5 dB and reduce measurement uncertainty by approximately ±0.4 dB.
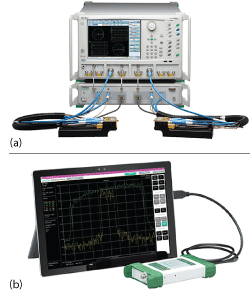
Figure 7 Current mmWave test systems: Anritsu VectorStar VNA (a) and MS2760A handheld spectrum analyzer (b).
mmWave TESTING ADVANCES
Advances in mmWave testing over the years are also enabling more accurate measurements at these frequencies. The introduction of the 40 GHz K connector in 1983, the 70 GHz V connector in 1989 and the 110 GHz W connector in 1997 are examples of such innovations.
Test equipment has also progressed to meet the market need: VNAs are now available to 145 GHz, as well as spectrum analyzers in ultra-portable form factors (see Figure 7). Some VNAs have very small mmWave frequency extension modules that enable full frequency coverage for on-wafer measurement systems. Using nonlinear transmission line (NLTL) technology allows the probes tips to be mounted directly to the modules, enhancing measurement and calibration stability. A handheld spectrum analyzer using this same technology is slightly bigger than a smartphone and provides performance similar to a benchtop instrument in a much smaller and more affordable design. The small size allows direct connection to almost any DUT.
CONCLUSION
In the past decade, technology improvements in semiconductors, components, cables, connectors and test equipment have helped make it possible for mmWave frequencies to be used for low cost commercial and consumer electronics products and systems. Engineers can ensure the performance of their designs at these higher frequencies by understanding and addressing the issues of connector mismatch error and cable loss, which will yield greater confidence in their products. The continuing evolution of test instruments will significantly reduce mmWave measurement challenges and improve measurement performance and accuracy.
