

Staying on top of all the changes in RF and microwave test – from the changing standards to the latest technologies - could practically be a full time job. And that's without the pressures of having to deliver new products on time and under budget.
For 2012, we'll be working to make the keeping up to speed part of your job a little easier with a steady flow of posts looking at RF and Microwave test theory and measurement concepts. In addition to hearing from me every other week, Johannes Benedikt, Chief Technology Officer from our technology solution partners from Mesuro Limited will join in each month as well. Together we'll provide short, timely posts that we're confident you'll find relevant and useful.
And remember, this is your space too. We'd love to hear from you about areas of interest and tips and techniques you'd like to share with the broad community. By sharing knowledge and best practices all ships are lifted.
To kick things off I thought I'd talk about visualizing resolution bandwidth filters. I recently came across a good analogy, from a colleague Alan Wolke, to describe the concept of resolution bandwidth, and why it takes so long to get discriminated signals close together.
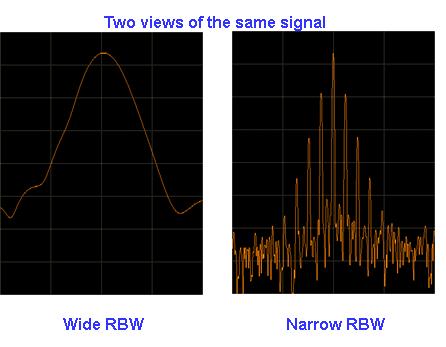
Let's say you want to see signals that might be 1 kHz spaced off a center frequency of 1 GHz. A typical 10 kHz RBW filter might give you the response as shown below in the "Wide RBW," while a 100 Hz RBW filter on the same filter would give you the insight of the "Narrow RBW." But the acquisition time is 100 times longer... Why?
Imagine you are standing on the overpass of a highway looking at cars driving away from you. Two cars pass underneath you exactly even, but in two separate lanes. Which one is going faster?
(Okay, in Europe, the fast lane is much more respected by observant drivers and the rules of the road seem to be enforced, however that's not necessarily the case in most of the US.)
As you stand on the overpass and catch a glimpse of the cars, a snapshot tells you they are even. But as you observe the cars for a fraction of a second, it would be easy to see the difference of one car going 90 mph vs. one car going 60 mph. The fast car would be moving 44 ft/sec ahead relative to the person going 60 mph. That's a couple car lengths in a second.
But the spectrum example described in the opening paragraph tries to show a discrimination of one part in a million. That's 60.00006 or 59.99994 mph relative to a car travelling exactly 60 mph. After an hour of observation, the cars would have moved about 4 inches relative to one another, and they would be 60 miles down the road. That guy going 90 mph would lap you around the world shortly!
Resolution bandwidth gives you a similar performance trade-off. When you need to discriminate signals that are fractionally similar in speed (1/frequency), you need to spend some time to get that insight.
Do you have any good analogies for resolution bandwidth concepts or other measurement concepts?