
Traditionally, oscilloscopes triggered on a simple edge or voltage level. Today, using a digital probe, the trigger can be a pattern of logic; for example, when a specific word appears on a bus, the scope can be triggered to make an analog measurement in the time domain. A mixed domain oscilloscope can add a further trigger advantage, providing the ability to simultaneously trigger and acquire signals across multiple channels. This results in time-correlated and seamless acquisitions in the analog, digital and RF domains, providing the ability to observe how the spectral and vector properties of the RF signal vary over time, along with the analog and digital signals. Complementing the advanced trigger system, a fully-automated suite of pulse timing measurements available for oscilloscopes can lead to more consistent results. Single-button selection of rise time, fall time, pulse width and other parameters simplify the measurement process and save time.
FREQUENCY DOMAIN MEASUREMENTS
The measurement of frequency domain characteristics of a transient, pulse-based system requires a specific type of spectrum analysis. While swept spectrum analyzers offer wide frequency and dynamic range, advances in analog-to-digital converters (ADC) and signal processing technology provide many of the same benefits while performing wide bandwidth, time domain acquisition, then post processing with a fast Fourier transform (FFT). Time domain acquisitions allow for very fast visualization of signals, referred to as real-time. Beyond speed, the advantages of real-time measurement capability are high quality persistence displays, frequency domain triggering and waveform storage, providing higher levels of measurement capability and insight.
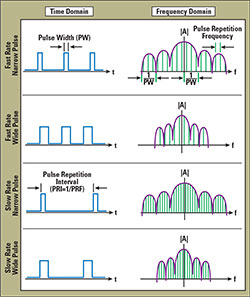
Figure 3 Relationship between spectrum and pulse width and PRF.
Figure 3 shows the relationship between the sin(x)/x spectrum in the frequency domain and a pulsed radar signal in the time domain. Longer pulses have smaller lobes, while shorter pulses have wider lobes, as discussed earlier. Because of the inverse relationship between frequency and time, it is possible to determine basic pulse timing parameters using the spectrum analyzer frequency domain display. The pulse repetition time or pulse period is the inverse of the frequency spacing between the finely-spaced lines within the larger spectrum envelope, and the pulse width is the inverse of the frequency spacing between the nulls in the spectrum envelope. Real-time and persistence display technologies allow observation of the frequency and frequency response and improve the ability to view the PRF.
The architectures of spectrum analyzers and oscilloscopes differ. The bandwidth of an oscilloscope is usually a function of the ADC technology and sample rate of the system, while a spectrum analyzer uses some form of frequency conversion (usually super heterodyne) to create an intermediate frequency that is centered around the frequency bandwidth of a narrow ADC. As bandwidth is inversely proportional to dynamic range, the spectrum analyzer has a better dynamic range, allowing the user to view very small signals in the presence of large signals. In comparison, an oscilloscope with a bandwidth of 18 GHz will have lower dynamic range than a spectrum analyzer with a frequency range of 18 GHz. However, the 18 GHz oscilloscope captures the whole instantaneous bandwidth (DC to 18 GHz), while the spectrum analyzer captures a narrower instantaneous bandwidth—±400 MHz around a center frequency of 9 GHz, for example.
Just as an oscilloscope can translate time domain data by performing an FFT and displaying the frequency domain spectrum, a spectrum analyzer can show measurement information in the time domain. Once the spectrum analyzer is tuned to an appropriate center frequency, the required measurement data can be displayed in either the frequency or time domain. As the time domain measurement on the spectrum analyzer is limited by the bandwidth of the ADC, the maximum LFM that can be observed in the time domain will be limited; in the example of the spectrum analyzer with an instantaneous bandwidth of ±400 MHz around a center frequency of 9 GHz, the maximum LFM sweep will be 800 MHz.
Another feature of the spectrum analyzer is adjustable acquisition bandwidth to make more selective measurements, by using a resolution bandwidth filter. This effectively reduces the displayed noise level. For example, a 3 kHz resolution bandwidth filter has a noise floor of 10 dB lower than a 30 kHz resolution bandwidth filter.
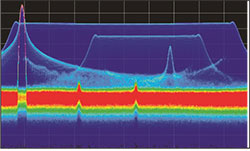
Figure 4 Using a phosphor emulation display reveals multiple chirps in one band.
New is not necessarily best; many newer spectrum analyzer models emulate the displays of cathode ray tubes (CRT) used on spectrum analyzers before the advent of digital displays. A CRT uses a magnetically-controlled electron gun that fires electrons onto a phosphor-coated screen. The electrons initially illuminate the screen and the image slowly decays with time. Figure 4 shows a typical display using a phosphor emulation technique. Without phosphor emulation, the screen shows just the large LFM signal, with the CW signal “popping out” the top on the left. Phosphor emulation enables a second, lower power LFM signal with several single frequency, pulsed carriers and two CW interferers to be seen.
As with an oscilloscope, spectrum analyzers are available with automated pulse measurements that increase signal detail and measurement repeatability. In some cases, a spectrum analyzer will have more advanced capabilities:
- Storing up to two hours of data
- Finding the pulses within the signal
- Measuring a full set of parameters for each pulse, such as timing, frequency and phase
- Processing the results to display trends or identify the transmitter.
PICKING THE RIGHT INSTRUMENT
High-resolution radar employs wideband techniques, either short pulses, impulses or a modulation technique such as LFM. Both oscilloscopes and spectrum analyzers are good tools for measuring performance in the time and frequency domains and can have equivalent measurement capability; however, the difference in instrument architecture makes one more optimal for some measurements than the other. An oscilloscope can have an extremely wide acquisition bandwidth in the tens of GHz, at the cost of dynamic range and sensitivity, which makes it ideal for capturing fast transient events such as narrow pulses, impulses and large frequency sweeps. A modern spectrum analyzer can tune to a specific frequency and acquire a signal in the range of a few tens of MHz up to 1 GHz, with better dynamic range and sensitivity, making it an ideal tool for broadband spectrum analysis, spurious signal searches, intermodulation and harmonic analysis.