

As the spectrum becomes more and more crowded, detecting sources of interference is tougher than ever and only becoming more challenging. Therefore it’s critical that spectrum managers are well-equipped to perform accurate spectrum measurements and quickly chase down interference signals. Here are 10 tips that will help anyone working in the spectrum management field improve off-air spectrum test and measurement.
1. Modern wireless technologies use time varying signals and are fitted into an increasingly crowded spectrum
Popular technologies like Wi-Fi and Bluetooth use time-varying signals in their designs to compensate for crowded spectrums and to reduce interference problems. Traditional test tools such as swept-tuned spectrum analyzers are not optimized for these new technologies. Skilled operators and technicians are required to use the traditional tools. Performing spectrum mapping and chasing down an interference signal often needs to be done quickly. Extra steps like having to go back and load data into a map, for instance, take time and slow down the overall process.
2. A wide dynamic range is critical as strong interferers can block reception and overload A/D converters
One important requirement for spectrum management equipment is to have sufficient dynamic range and selectivity to avoid jamming from interferers closely located to the desired frequency. Strong interferers can saturate analog-to-digital converters (ADCs), blocking the reception of a desired weak signal. Strong interferers can also create intermodulation products in an analyzer that prevent successful analysis of the desired signal. Having sufficient dynamic range allows the signal analyzer to separate weak signals in the presence of strong signals.
3. Some phase noise is always present and excessive noise can hide signals
An analyzer’s internal phase noise can also be an important attribute for many signal interception applications. Even with outstanding dynamic range, if the analyzer’s local oscillator (LO) phase noise is not sufficiently low, some signals may be impossible to receive. The LO in the analyzer’s receiver can obscure the desired weak signal. Once obscured, the demodulator can no longer see the two signals and resolve one from the other, and the weaker signal is lost.
4. Locating signals is critical
Using a directional antenna, the signal strength function on analyzers can enable you to define a specific signal within a band of interest. As the level increases, the audible tones can allow you to maximize the line of bearing. Cities are a particular problem since they are filled with reflections. The best way to cope is to keep moving and to get as many lines of bearing as possible. The more lines of bearing, the smaller the amount of uncertainty.
5. Built-in GPS Receiver ≠ Built-in GPS Mapping
Trying to figure out where a signal or noise is coming from can take a long time. Geo-referenced measurements provide situational data. With a GPS trigger engine, how often a signal occurs and where it occurs can be determined using either manual or automated drive measurements.
6. Signal identification can sometimes be challenging
A signal classification database can be used to identify signals based on their frequency, occupied bandwidth and spectrum signature, as shown in the screen capture below, where the spectrum analyzer was able to identify a signal as Bluetooth channel 39. Use the built in library of signals and even customize it by adding your own signals to quickly and confidently identify signals.
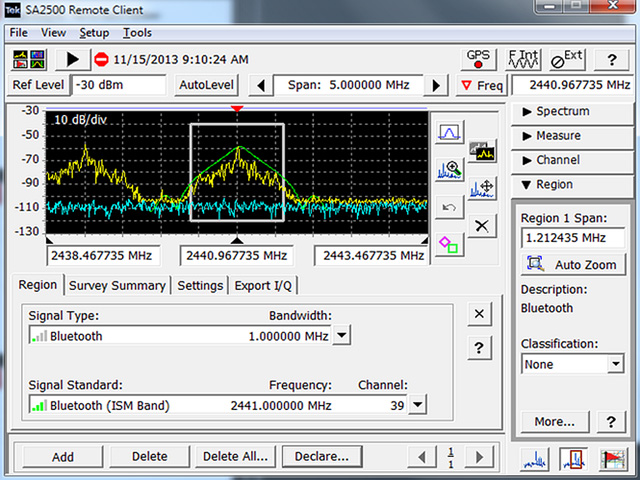
Use your spectrum analyzer’s signal classification database to quickly identify signals, such as this Bluetooth channel 39.
7. Once you do a site survey, customizing your own site survey signal database will save you time.
Trying to identify a specific signal in a forest of spectrum is challenging. A signal classification database provides signal identification as well as the means to inventory your spectrum information. You can mark and identify your spectrum so that unknown emitters can be easily detected.
8. Pay close attention to RBW settings
The resolution bandwidth (RBW) control acts as a filter allowing you to discriminate between wide and narrow signals in the same span by changing the RBW value. If RBW is too wide, the spectrum analyzer is going to miss smaller signals that might be close in to a larger signal. With a very narrow RBW, it can easily discriminate the two signals that are close together. However, a narrow RBW will slow down the spectrum analyzer, meaning that a longer signal duration is required in order to guarantee probability of intercept.
9. Real-time analysis can help insure that you don’t miss randomly occurring events
Real-time technology is specified by the rate at which the output can keep up with the input. The spectrum update rate and the minimum event duration are the key parameters. The performance is key to being able to see low-level signals as well as signals within a crowded spectrum; being able to discern spectrums and signals from one another. Higher performance spectrum displays can process more than 10,000 spectrum updates per second, assuring reliable discovery of short-duration events.
10. Use density triggering for time correlation of events
While the target signal is absent, the density measurement characterizes the “normal” signals. When the target signal finally appears, the density value increases. The trigger system monitors the density measurement and activates a trigger whenever the density value exceeds the adjustable threshold. The instrument can automatically set this threshold to a level somewhere between the normal density readings and the density due to the trouble-making signal. This means you can trigger on very small signals even in a dense spectrum environment.
Have any more tips for making spectrum management easier? Please post in the comments below or drop me a line.
# # #
Richard Duvall is a senior technical marketing manager for Tektronix, a leading worldwide provider of test, measurement and monitoring instrumentation.