

Figure 1 Antenna measurement system in an anechoic chamber.
Antenna measurements involve recording the radiated coupling between a measurement antenna and the antenna under test (AUT). Figure 1 shows an example set up inside an anechoic chamber, in which the measurement antenna acts as the transmitter and the AUT operates in reception. The goal is to record the direct coupling. Indirect coupling via scattering from walls and surrounding structures in the chamber results in an error on the measured data. This unwanted scattering can be eliminated from the measurements by taking advantage of time domain techniques commonly used in radar.
A typical radar application, which uses two separate antennas for transmission (Tx) and reception (Rx) of the signals, is illustrated in Figure 2. The Tx antenna radiates a signal into open space (red arrows). The signal (straight red arrows) illuminates different objects arbitrarily distributed in space, as shown in the figure. The randomly spaced objects reflect the illuminating signal, and the reflected signals (blue arrows) in turn illuminate the Rx antenna, which are often located in close proximity to the Tx antenna. The received signal is to be processed, and the resulting information is used to indicate the presence of objects in the surrounding space, to identify the objects, and to track or characterize them, if necessary. Clearly, the better the radar system dynamic range and sensitivity, the longer the useful range. As is also shown in the figure, a concurrent direct leakage signal radiated by the Tx antenna in the direction of the Rx antenna (curved red arrow) is typically present and thus can also contribute to the total received signal. This concurrent signal is often comparable or even stronger than the received signal contributions from reflections from the objects.

Figure 2 Typical radar operation diagram.
Clearly, the leakage signal (curved red arrow) is a disturbing factor to normal radar operation and should be either separated from the desired reflected signals (blue arrows), reduced as compared to the reflected signals, or eliminated completely. In order to accomplish this, it is necessary to consider parameters that would differentiate these signals. The time of arrival is the most distinguishing characteristic differentiating these signals. Since the Tx and Rx antennas are typically located much closer than the distance to the detected objects in space, the leakage signal arrives at the Rx antenna sooner in time than the signals reflected from the detected objects.
Various techniques are used in radar applications to differentiate signals based on their different times of arrival, including utilization of specialized Tx signal modulation and/or time-gated Rx software/hardware processing. Gated time-domain techniques have been in use for years in many radar installations. Time-gating is a hardware feature or computer processing algorithm capable of transferring the data acquired in the frequency domain to the time domain, where the time response allows one to observe the time sequence of multiple received signals and to subsequently discriminate between them. When the desired signal is selected from the sequence of time distributed signals, it can be time-gated by applying the proper mathematical pass band filter (which again can be realized either in hardware or software). The filtered data can then be transformed back to the frequency domain, providing the required time-gated data. The extrapolation of this technique to radar cross section (RCS) measurements is straightforward, and as such has been implemented in many RCS measurement systems.
Alternatively, another set of applications requires the use of the direct signal, while requiring the reflected signal to be negligible. Such applications include wireless communications (where the Tx and Rx antennas can be directed toward each other in order to improve signal to noise ratio); antenna measurements, where unwanted reflections can occur from objects surrounding the measurement range in outdoor far-field (FF) antenna measurement ranges; and from the absorbing walls in indoor anechoic antenna measurement chambers. In antenna measurements, the antenna locations and pointing directions may vary during the measurement, and thus any reflections (including multiple reflections in anechoic chambers where the walls are treated by absorbing materials) may affect the antenna measurement accuracy. Similarly, the reflections reduce the antenna measurement accuracy in near-field (NF) antenna measurement systems. Time-gating techniques can be very useful to eliminate unwanted reflections, and thus to improve antenna measurement accuracy. A few interesting examples are described, which are intended to illustrate the effectiveness and usefulness of time-gating techniques in the antenna measurements.
Reflectivity Assessment in a Far-Field Antenna Measurement Chamber at UHF Frequencies
Unsatisfactory quiet zone performance can be found in rectangular chambers designed for operation in the UHF band using a classic 60° side wall incidence angle approach. In this design, the ratio of the width (W) or height (H) of the chamber to the separation distance between the source antenna and the antenna under test (L) satisfies the relationship W/L ≈ H/L <= 0.5. The approach has been successfully implemented in hundreds of anechoic chambers operating at frequencies higher than 2 GHz. However, extrapolation of this design down to frequencies as low as 200 MHz, where the chamber cross section becomes electrically small (such as 3 to 4λ), fails to perform as well as at L-band and higher frequencies. This despite the fact that higher grade absorbing materials (taller than 48") are often utilized to treat the chamber metallic walls at UHF, and the free space VSWR test procedure (the classical method for chamber validation) performed at the discrete UHF frequencies often shows satisfactory reflectivity during the testing. However, thorough investigation reveals that, at UHF, the VSWR procedure can lead to incorrect quiet zone performance interpretation.1

Figure 3 Frequency domain vertical (blue) and horizontal (black) co-polarized signals in the quiet zone of an anechoic chamber of UHF.
Figure 3 shows measurement results in a chamber where log periodic dipole (LPD) antennas were used as both a source and a probe antenna. The antennas were installed such that their boresights coincided with the chamber central line. The two curves correspond to the cases where the polarizations of both antennas are identical and are either vertical (V) or horizontal (H). In theory, these two curves should coincide. In a well designed chamber, the difference may be on the order of 1 dB or so at UHF. However, in the figure, the difference reaches 3 dB or more across some frequency intervals. The difference in polarizations at 200 and 300 MHz (discrete frequencies where the free space VSWR test was executed) were acceptable.

Figure 4 Time domain vertical (red) and horizontal (green) co-polarized signals in the quiet zone of an anechoic chamber at UHF.

Figure 5 Direct and reflected time-gated frequency signals for both polarizations.
Figure 4 shows curves of the time- domain data for these cases. It can be seen that the strongest and virtually equal signals for both polarizations are received in the time interval from approximately -30 to -10 ns. At later times, the difference becomes pronounced, so that this time interval can be attributed to the direct illumination and the rest of the responses from -10 to 100 ns to multiple reflections. Performing the time-gating and transforming the data back to the frequency domain, the direct and reflected time-gated frequency signals for both polarizations are obtained and are shown in Figure 5. The vertical (blue) and horizontal (pink) time-gated co-polarized direct illumination signals in the quiet zone are shown as well as the vertical (yellow) and horizontal (navy blue) time-gated co-polarized quiet zone signal reflected from the walls of the chamber. This shows that the reflected signals actually exceed the direct signal at 200 to 300 MHz by more than 12 dB. The reason the free space VSWR results appeared acceptable at these frequencies is that the VSWR processing inevitably interpreted the dominant reflected signals as the direct one, leading to incorrect conclusions regarding chamber performance.
In addition, the figure explains a less than desirable chamber performance in the range of 400 to 600 MHz (see the V and H polarization differences in Figure 3) and shows that the chamber can be used for high quality conventional far-field antenna measurements, starting from 700 MHz and above, where the reflected signals are well below the direct illumination signal.
Accurate Cylindrical Near-Field Antenna Measurements
A broadband dual ridge diagonal horn antenna (ORBIT/FR model FR6417) operating in the frequency range of 950 to 3000 MHz has been tested using a cylindrical near-field measurement system. The size of the aperture along its diagonal is approximately 3.5 feet, and the gain is more than 15 dBi over the frequency band considered. The test set up includes a vertical scanner for the probe vertical motion and an azimuth positioner for the antenna under test (AUT) rotation. The dimensions of the measurement room were such that the measurement set up barely fit within the room confines. Twelve inch absorbing material was used to cover all of the side walls and floor of the room. Moreover, as a part of the test program, and in order to evaluate the efficiency of the time-gating algorithm, a "window" on one side wall was left bare without absorber treatment.

Figure 6 Far-field patterns obtained using cylindrical NF-FF transformation with and without time-gating algorithm.
All the measurements were accomplished in two sub-bands using two standard open ended rectangular waveguide (OEWG) probes—WR650 and WR430—covering a frequency band of 0.95 to 3.0 GHz in frequency increments of 25 MHz. The primary measurement goal was to eliminate the room scattering error in the measurements with the aid of the time-gating algorithm. In order to accomplish this, the measured raw near-field data was "pre-processed" by time-gating, and the two sets of raw data—"pre-processed" and "unprocessed"—were transformed to far-field patterns using a standard cylindrical near-field to far-field transformation algorithm. The far-field patterns were then compared. The measurement results are presented in Figure 6. The far-field patterns obtained with the use of raw, unprocessed cylindrical near-field data are presented in the left column. The patterns obtained using the raw but pre-processed set of data prior are presented in the right column. As can be seen from the left column, the presence of the window "uncovered" by absorber on the right side wall of the chamber can be clearly identified by a high level of ripple in the large sector of pattern angles on the right [+30° to +120°]. Moreover, there are noticeable perturbations seen at negative angles on the patterns. This is explained by the insufficient absorption provided by using only 12" high absorbing material at frequencies in the vicinity of 1.0 GHz in the "small" anechoic chamber utilized for the tests. As seen in the right column, the side lobes and perturbations are significantly reduced. Also, the patterns in the right hand column show better symmetry around its bore sight, indicating improved measurement accuracy.
Short Range Far-Field Antenna Measurements of a Low Gain Antenna on a Ground Plane
In many commercial applications, the performance of low gain antennas is closely associated with and depends on the geometry and size of the device the antenna is attached to, mechanically connected to, or the properties of the skin in which the antenna is embedded. Some antennas, such as satellite radio antennas used in automobiles, are attached to the roof. The vehicle roof acts as a large ground plane and is an essential part of the antenna that influences the antenna pattern. In order to accurately measure such antennas in an anechoic chamber, a large metal plate is frequently used to simulate the ground plane. A number of questions should be answered in order to make sure that the measurements of the low gain antenna on a ground plane are accurate. These questions include:
- What size metallic plate is to be considered to minimize the edge diffraction associated with the ground plane? This is important in order to isolate the antenna performance from the edge effects introduced by a terminated (finite size) ground plane, as well as to extrapolate the measurement results to "ground bodies" of different geometries.
- What size metallic plate is to be considered to evaluate the dimensions of the "effective" metallic plate that functionally participates in the formation of the far-field antenna pattern?
- What measurement facility and measurement technique are to be used to accurately predict the antenna pattern? A low gain antenna typically does not require large and expensive anechoic chambers for far-field antenna pattern measurements. However, the addition of a metallic ground plate increases the effective size of the antenna under test and, accordingly, increases the required size of the anechoic chamber, which results in a more expensive test facility. An alternative solution is to implement a spherical near-field (SNF) testing technique. This technique, although the data acquisition is identical to conventional far-field antenna measurements, does not require a large anechoic chamber. With this technique in mind, a two-step procedure can be implemented to answer the first two questions above.
- Time-gated pre-processing of "raw" SNF data, which reduces the edge diffraction, effects and delivers a "true" far-field pattern. Note that the application of time-gating for a narrow band antenna (a satellite radio antenna, for example) means using test frequencies outside the designed operational band of the antenna. As long as the antenna radiates (or receives) at a level above the noise floor, information may be extracted to create the time-domain response of the test antenna, which may then be time-gated to remove unwanted scattering sources.
- Compare the pre-processed SNF field with the corresponding far-field pattern. If the SNF pattern coincides with or closely resembles the far-field pattern, this indicates that the separation between the SNF probe and the AUT (in this case a low gain antenna with a metallic ground plane) used during the SNF "raw" data acquisition was at the minimum required far-field separation. This information can be applied to estimate the "effective" size of the ground plane, and effectively replaces longer (in time) near-field measurements with a far-field measurement at a near-field probe to AUT separation. In particular, two principal plane pattern cuts can be acquired significantly faster, and without the post-processing complexity.

Figure 7 Satellite radio antenna on a metallic ground plane.
The low-gain antenna used for this measurement is less than ½-inch thick with a two-inch diameter, using an 8-inch coaxial feed line. The operating frequency was approximately 2.3 GHz. The antenna is mounted in the center of a 38-inch diameter metallic ground plane, as shown in Figure 7.
A WR-430 rectangular open-ended waveguide was used as a probe antenna. The separation used for the measurements was 33 inches. The test bandwidth was extended to ±15 percent of the nominal bandwidth of a WR-430 rectangular waveguide. This provided a useable 1.56 GHz bandwidth, or 7.7 inch resolution, for the tests.
The far-field distance for the test antenna is only approximately two inches. However, if the largest aperture is assumed to be determined by the size of the metallic ground plane to which the test antenna is attached, then the minimum far-field distance becomes over 61 feet.

Figure 8 Measured SNF-FF ungated and gated time domain response for vertical (red) and horizontal (blue) polarizations.
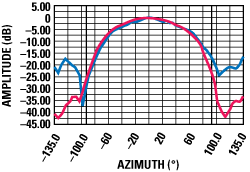
Figure 9 Measured SNF-FF ungated (blue) and gated (red) azimuth pattern for vertical polarization.
Figure 8 shows the ungated and gated time-domain response of the measured far-field data for both horizontal (blue) and vertical (red) polarization. A 10 ns time-gate was used to filter the response. Figure 9 shows the result of gating the time-domain response of the far-field data on the azimuth pattern. The ripple in the main beam is reduced or eliminated. In addition, the scattering lobes beyond 90° (behind the metallic ground plane) are reduced to better than 30 dB below the peak of the main beam, clearly indicating that the edge diffraction effect is significantly reduced.

Figure 10 Comparison of time-gated SNF and time-gated FF azimuth patterns for vertical and horizontal polarizations.
Figure 10 compares the time-gated SNF and time-gated far-field azimuth patterns. As can be seen, any differences between the patterns is virtually absent in the forward hemisphere, and are well within practical tolerances (only a few dB at the -40 dB pattern level) in the back hemisphere, indicating that the antenna with metallic ground plane can be effectively tested using a time-gated far-field antenna measurement scenario with the source (probe) antenna separated from the AUT on as short a distance as 33 inches instead of the predicted 61 feet.
Conclusion
A series of examples presented above has demonstrated that the time-gating technique, either as a stand-alone process, or in combination with other widely used techniques, can be effectively applied to enhance a broad range of practical measurement applications ranging from classical radar to a number of diversified antenna measurement situations. In particular, time-gating applications at UHF frequencies or in combination with antenna near-field techniques deliver a high quality result that could not be achieved with other methods.
References
- J. Aubin and M. Winebrand, "Test Zone Performance in Low Frequency Anechoic Chambers," 2008 Antenna Measurement Techniques Association Annual Symposium Proceedings, pp. 482-488.
- M. Winebrand, R. Soerens and J. Aubin, "Measurements of Low Gain Antennas on a Ground Platform Using a Short Range Time-domain Far-field Technique," 2007 Antenna Measurement Techniques Association Annual Symposium Proceedings, pp. 357-361.
- J. Aubin, M. Winebrand, R. Soerens and V. Vinogradov, "Accurate Near-field Measurements Using Time-gating," 2007 Antenna Measurement Techniques Association Annual Symposium Proceedings, pp. 362-367.