
When the Hubble Satellite was launched in 1990, the joke was that it was the third best optical satellite in space, but that the two better ones were pointed in the opposite direction. While it is still true today that more satellites are looking downward than upward, satellites are now much more likely to include sensors for other than just the optical portion of the electromagnetic spectrum. They now involve many other bands, including millimeter-waves, for specific data collection tasks. While the heavy lifting for satellite-based data gathering is still accomplished at optical and infrared frequency ranges, the microwave and millimeter-wave ranges offer specific advantages that make them far better suited to certain satellite missions. Millimeter-wave remote sensing serves two main functions: spectral line detection (spectroscopy), to distinguish the spectral signature for a specific element or molecule and determine its relative abundance and speed; and radiometry, to ascertain the temperature of the radiating source. Because of this technology, millimeter-wave sensors on satellites have become extremely important tools for gathering data: astrochemistry and continuum noise measurements when the satellite is pointed upward, and weather forecasting (using a variety of measurements), oceanography, ozone and soil moisture measurements when pointed downward. A discussion of the more relevant satellite systems employing millimeter-wave technology follows.
Millimeter-wave Spectroscopy
The primary application for remote sensing at millimeter-wave frequencies is the detection of molecules of various substances. When molecules collide, they emit faint electromagnetic signals at specific frequencies called spectral lines. These signals are detected using a sensitive receiver equipped with an RF spectrometer centered on a frequency band near the spectral line of interest. Examples of a receiver and received spectrum are shown in Figures 1 and 2. Molecules can also absorb energy at discrete frequencies. This is responsible for the absorption of millimeter-wave energy by the atmosphere, as shown in Figure 3. Viewing gases against a broadband source such as the sun is another method of detecting molecule species by their absorption spectra. The absence of signal at a particular frequency indicates spectral line absorption associated with a particular energy state of a species.
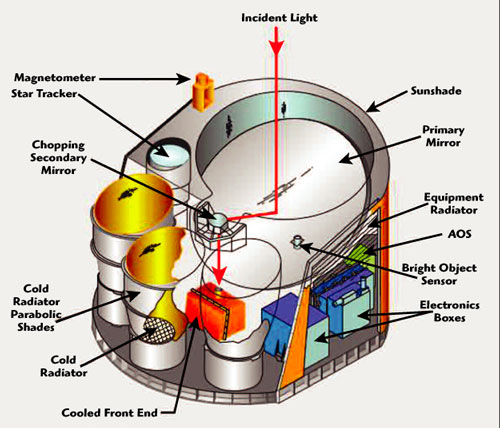
Fig. 1 The submillimeter-wave Astronomy Satellite (SWAS) instrument (courtesy of Harvard University). 1

Fig. 2 Spectral lines measured by SWAS. 2
For atmospheric monitoring by satellite, several molecules of interest have spectral lines at millimeter-wave frequencies, including oxygen (60, 180 GHz), water vapor (22, 183 GHz), ozone (184, 206 GHz) and chlorine monoxide (204 GHz). For certain molecules, millimeter-wave frequencies have advantages over infrared (IR) and near-IR, as millimeter-waves are not easily obscured by cloud cover. The width of spectral lines varies with pressure due to a phenomenon known as pressure-broadening. Since the atmospheric pressure changes with altitude, a spectral line measurement contains a combination, or superposition, of lines of various widths. Using sophisticated modeling techniques, the abundance of a species can be determined as a function of altitude in a given column of atmosphere. This technique is used to characterize a profile of water vapor versus altitude, which is in turn used by weather-modeling software along with many other data measurements, to forecast the weather.

Fig. 3 Average atmospheric absorption of millimeter waves (horizontal propagation). 3
Atmospheric measurement instruments aboard satellites have significant advantages over their earth-bound counterparts. For one thing, ground-based atmospheric measurements are mainly limited to landmass locations with little coverage of the oceans. Satellites that point toward the earth (nadir observations) are particularly effective at collecting oceanic data, since broadband radiation from the land reduces the sensitivity of these measurements. While all objects emit broadband radiation that is proportional to their temperature (blackbody radiation), the emissivity (the ratio of the radiation emitted by a surface to the radiation emitted by a blackbody at the same temperature) of the oceans is much lower than that of landmasses, thus lessening the effect. Measurements of the atmosphere can also be made against the cold (2.7 K) background of space by looking through the edge, or limb, of the atmosphere. The instruments that make these types of measurements are known as limb sounders, and are used for the most sensitive atmospheric measurements.
A principal goal for astronomers is to determine the chemistry of star formation from gaseous clouds. Water vapor, carbon monoxide, molecular oxygen and atomic carbon are of particular interest. These molecules are more likely to convert kinetic energy to radiation and their radiated spectra are important artifacts of stellar evolution. Radio astronomers have studied the chemical composition of molecular clouds for decades using earth-based telescopes. However, the earth’s atmosphere tends to obscure many of these species from earth-bound instruments, particularly at submillimeter-wave and higher millimeter-wave frequencies. This limitation has led to the development of satellite-based radio telescopes such as Smithsonian Astrophysical Observatory’s Submillimeter-wave Astronomy Satellite (SWAS). Using such satellites, astronomers have been able to measure the abundance of various molecule species that lead to star formation.
Spectral measurements require the use of RF spectrometers. A spectrometer is a specialized instrument that can simultaneously detect a series of multiple frequencies. Typical laboratory spectrum analyzer measurements sweep a narrow receiver across a band of interest, and only one frequency can be detected at any given time. Spectrometers are able to detect signals at all frequencies across their band simultaneously, greatly improving the sensitivity of the measurement.
There are three basic types of spectrometers: filter banks, autocorrelators and acousto-optic spectrometers. A filter bank, as the name implies, is simply a series of filters at successive frequencies with detectors at their outputs. The filters are multiplexed at their input and since each filter has its own detector, simultaneous spectral measurements can be made. This is the most effective solution when only a small number of channels are required, as in the case of atmospheric measurements. For astronomical applications, filter banks are less practical because the spectral line frequencies can undergo large Doppler shifts due to the relative motions of stellar and interstellar sources. The spectral line frequencies are not fixed and therefore require a greater number of channels. Conceptually, digitizing the RF band and applying a Fourier transform is another method of deriving the RF spectrum. Unfortunately, real-time fast Fourier transforms (FFT) are not practical much above audio frequencies. By mixing the RF with a time-delayed version of itself using logic circuits known as autocorrelators, a digitized RF can be autocorrelated in real time with significant bandwidths. The power spectrum can then be derived by transforming the integrated data. The biggest drawback of autocorrelators for satellite applications is their significant power consumption requirements. The third type of spectrometer is an acousto-optic spectrometer (AOS). An AOS introduces RF signals into one end of a crystal structure known as a Bragg cell. Acoustic waves in the Bragg cell create a density distribution that mimics the RF signal and acts like a diffraction grating to a coherent light source used to illuminate the cell. The light emerges from the grating at different angles and intensities based on the respective frequency and amplitude of the RF input. The light is then detected on a charge-coupled device (CCD) that integrates, or counts, the power in respective frequency channels. An AOS makes an ideal choice for satellite-based radio astronomy applications since broad bandwidth and high resolution are possible with relatively low power consumption.
Radiometry
As molecules coalesce into larger particles, they no longer emit radiation in spectroscopic lines; instead, they emit over a broad continuum of frequencies. Planck’s function calculates the maximum emission magnitude from an object, based on the temperature of the object and the measurement frequency. The actual radiation magnitude from an object is reduced, however, by the emissivity of the object. An object that radiates exactly the Planck calculated value (emissivity = 1) is termed a blackbody. A radiometer is a very sensitive receiver that measures extremely low power radiation across a continuum of frequencies in order to determine the temperature and emissivity of an object. Radiometers are used on satellites for a variety of purposes. One application is to measure the temperature of dust in star-forming regions, or in the vast regions between stars. The degree of frequency shift of the radiation curve from Planck’s function indicates the speed of the dust relative to our position in space. This is known as the red shift.
Another application is the calibration of space radars such as Ku-band altimeters. Sea surface mapping is of great interest to oceanographers and climatologists (not to mention the military), but even at Ku-band the atmospheric effects make it impossible to achieve the needed accuracy. The two factors are temperature and water vapor, which can be characterized very precisely with radiometers operating on or near the oxygen line at 60 GHz and the water line at 22 GHz. Using the reverse superposition technique mentioned earlier, the temperature of the pressure broadened oxygen in the atmosphere is characterized versus altitude, which can be assumed to be equal to the temperature of the air versus altitude. For water vapor content, all that is needed is the total collimated amount of water vapor to calibrate for the effective dielectric constant of the air in the column due to water vapor. With prior knowledge of the temperature profile and the water vapor content, the accuracy of a Ku-band altimeter is greatly improved.
Active Sensing
Both spectroscopy and radiometry are passive techniques, in that they only receive and do not transmit any RF energy. Active techniques, such as various types of radar from satellites, have been used in the microwave range but not the millimeter-wave range until the launch of CloudSat this summer (see Figure 4). Millimeter-wave systems are relative newcomers to satellites, and while bringing enhanced resolution and reduced antenna size in comparison to microwave systems, they are also encumbered with lower power levels and higher attenuation levels through the atmosphere. Power levels delivered from millimeter-wave MMICs are continuing to rise, particularly with the advent of wide bandgap materials for MMIC substrates. Active sensing from satellites in the millimeter-wave band will first be realized by the CloudSat satellite, which will be used for the profiling of cloud condensation and precipitation. This is accomplished by a 94 GHz pulsed radar (2 kW pulses, 3.3 ?s long, every 0.32 sec) with a vertical resolution of 500 m. As was the case with microwave space radars, other new areas of research will likely follow. One such example is the discovery of subsurface prehistoric river systems beneath the Sahara Desert by the Shuttle Imaging Radar system,4 which constructed images of the ground from synthetic aperture radar scans at 1.3, 5 and 10 GHz. A future microwave active-sensing satellite of note is the US Air Force’s Space-based Radar, which is a constellation of satellites for the tracking and targeting of ground-based targets using synthetic aperture radar. For a more detailed view of millimeter-wave systems on satellites, let us first review past satellite systems before exploring current and future projects.

Fig. 4 CloudSat Satellite at Vandenberg AFB (courtesy of CloudSat Web site). 5
Past Systems
The history of millimeter-wave remote sensing from space began in December of 1972 when NASA launched the Nimbus-E, the fifth in a series of polar-orbiting meteorological satellites. Two millimeter-wave sensors were onboard: the Electrically Scanning Microwave Radiometer (ESMR) operating at 19.35 GHz, and the Nimbus-E Microwave Spectrometer (NEMS) operating five channels at 22.235, 31.4, 53.65, 54.9 and 58.8 GHz. These instruments allowed scientists to discover the “hidden” features of the earth and atmosphere, previously unavailable from established optical and IR instruments, as their measurements are hindered by cloud cover. Although these millimeter-wave instruments were experimental, they provided data to demonstrate that surface temperature, atmospheric water vapor content and temperature profiles could be obtained globally from space. An additional advantage is the ability of these “hidden” characteristics, especially water vapor, to enhance the accuracy of IR instruments. Millimeter-wave instruments have been everpresent on meteorological satellites since the launch of Nimbus-E (see Figure 5). The Nimbus-F was launched two and a half years later. This satellite had a different ESMR, which operated at 37 GHz, and the NEMS was replaced by a similar, but more advanced, Scanning Microwave Spectrometer (SCAMS). This also provided five channels in the same bands but utilized slightly different frequencies. The two ESMRs were both the first and last space-based, electrically-scanning millimeter-wave instruments. All subsequent millimeter-wave sensors have utilized mechanically-scanned mirrors, which provide optimal performance with respect to loss and beam efficiency. The seventh and last of the Nimbus satellites was G, launched in 1978 (see Figure 6). It carried another breakthrough instrument, the Scanning Multispectral Microwave Radiometer (SMMR). One of the key characteristics of the SMMR was that it operated with a conical scan geometry, providing consistent size and shape of the field-of-view (FOV) or “footprint,” as well as constant incidence angle on the earth’s surface. This was important because its primary objective was to measure surface characteristics with frequencies of 6.6, 10.7, 18, 22 and 37 GHz, all dual-polarized (H&V) for ten channels of data.

Fig. 5 Nimbus-E (courtesy of NASA). 6
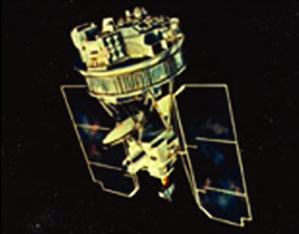
Fig. 6 Nimbus-G (courtesy of NASA). 7
The SMMR inaugurated a special class of instrument, the conical scanner. Conical scanners are configured with upward-firing feedhorns in which the reflector redirects the FOV back down toward earth. As previously mentioned, this provides a constant footprint, incidence angle and polarization throughout the scanning sector, an important factor when processing data and developing retrieval algorithms. This geometry has also enabled the use of larger reflector antennas in later instruments. However, the drawbacks of the conical scanner are:
The scan track is an arc, which previously presented a challenge to mapping efforts.
- The arc and incidence angle introduce a Doppler shift, which varies with scan position. This issue is infrequent as it applies only to those channels that require frequency accuracy better than a few megahertz.
- The topside placement on a spacecraft leaves the instrument “hanging in the breeze” so to speak, leaving it without the support and protection of the spacecraft instrument platform and sun shades. These characteristics typically make conical scanners much more complex than their smaller counterparts, but also provide the ability for a larger antenna system and better spatial resolution.
Millimeter-wave instruments were incorporated on the NASA/NOAA upgraded next generation Television InfraRed Operational Satellite (TIROS-N). Ten TIROS-N satellites (A thru J) were launched between 1979 and 1994, each carrying the Microwave Sounding Unit (MSU) as part of the TIROS Operational Vertical Sounder (TOVS). The MSU, built by JPL, was essentially an improved SCAMS with four channels from 50 to 58 GHz, providing temperature profiles of the atmosphere. More MSUs have been put into orbit than any other millimeter-wave instrument.
In 1983, the USAF Defense Meteorological Support Programs (DMSP) incorporated its first millimeter-wave instrument with the Special Sensor Microwave/Temperature, built by Aerojet (see Figure 7). The SSM/T implemented seven channels from 50 to 60 GHz, providing an atmospheric temperature profile superior to the TIROS-N MSU, with only four channels. The next launch in 1987 achieved another milestone, launching the Special Sensor Microwave/Imager (SSM/I) aboard the Block 5D2-F8 spacecraft. The SSM/I was built by Hughes and implemented the first total-power radiometers in space. It was a conical scanner similar to the SMMR but with seven channels: 19H, 19V, 22V, 37H, 37V, 85H and 85V. The SSM/I provided unprecedented results due to the improved sensitivity of the total power radiometers and the high spatial resolution of the 85 GHz channels. The last of six SSM/Is was put into orbit in 1997.

Fig. 7 View of the 5D-3 spacecraft (courtesy of DMSP). 8
In 1991, NASA deployed the Upper Atmospheric Research Satellite (UARS) from the Space Shuttle. This was an extremely large platform, which included a Microwave Limb Sounder (MLS) built by JPL. The MLS features three channels at 60, 183 and 205 GHz. It measures the characteristics of the earth’s limb where the FOV grazes through the atmosphere, without looking to the surface. In 2004, an updated version of the MLS was launched on NASA’s Earth Observing Satellite (EOS) Aura. The 183 GHz channel was dropped and replaced by two submillimeter channels.
In 1991, the DMSP achieved yet another milestone when the Special Sensor Microwave/Temperature-2 (SSM/T-2) was launched with the SSM/I and SSM/T on a 5D2-F11. SSM/T-2, also built by Aerojet, has five channels: one at 91, one at 150 and three at 183 GHz. This represented the most comprehensive suite of millimeter-wave remote sensing instruments ever assembled on a single spacecraft.
In 1987, Japan joined the space age with respect to meteorology and millimeter-wave remote sensing with the launch of the first Marine Observation Satellite (MOS-1). MOS-1 carried IR sensors and the Microwave Scanning Radiometer (MSR), which provided K- and Ka-band channels for atmospheric water vapor measurements. MOS was then followed by the Tropical Rainfall Measuring Mission launched in 1997, a joint effort between NASA and Japan. The TRMM Microwave Imager (TMI) built by Hughes was similar to the SMMR and SSM/I with channels from 10.7 to 85.5 GHz. Meanwhile, microwave and millimeter-wave remote sensing had gained interest from the international community as manifested with the formation of the European Space Agency (ESA). ESA’s first Remote Sensing Satellite (ERS-1) was launched in 1991 and ERS-2 in 1995, both with similar Ku-band altimeters for sea surface mapping and both including 23.8 and 37 GHz radiometers to calibrate the path length effect of the water vapor. In 1992, TOPEX/Poseidon was launched. It includes a 13.5 GHz sea surface radar altimeter and is now in the 12th year of its original three-year mission. Others have followed, such as GeoSat Follow-On (GFO) for the US Navy in 1998, Jason-1 in 2001 and EnviSat in 2002. The original GeoSat was classified in 1985 and GFO presented improvements in all aspects of the original. TOPEX/Poseidon and Jason-1 are both joint NASA/CNES projects, while EnviSat is an ESA satellite built by Astrium. Cooperative projects between NASA, ESA and other individual countries had been developed, and in 1998 NASA and NOAA launched the latest TIROS, NOAA-K, with several new sensors provided by ESA participants. The cornerstone of the millimeter-wave instruments was the Advanced Microwave Sounding Unit (AMSU), built by Aerojet. It was comprised of three modules: AMSU-A1, featuring the highest altitude temperature sounding with 12 channels from 50 to 58 GHz and another channel at 89 GHz; AMSU-A2, featuring 23.8 and 31.4 GHz with a larger antenna to provide a matching footprint; and AMSU-B, featuring 89, 150 and three 183 GHz channels similar to the SSM/T-2. The AMSU instruments have been launched on a total of four Advanced TIROS spacecraft (K, L, M and N) in 1998, 2000, 2002 and most recently in 2005. The latest launch replaced the AMSU-B with the Microwave Humidity Sounder (MHS), which has essentially the same features but is built by Astrium EU as part of furthering international cooperation. Additional AMSU instruments have been included on the EOS ADEOS-II, launched in 2002, and the EOS Aqua satellite in 2004. More recently, Japan has developed a conical scanning instrument, the Advanced Microwave Scanning Radiometer (AMSR). It is similar to the TMI except that its lowest channel is 6.9 GHz and a total of nine channels extend to 89 GHz. The AMSR has been launched on the ADEOS-II and EOS Aqua satellites.
The DMSP has recently launched an upgraded satellite, the 5D-3. On this spacecraft the function of all three SSM instruments (SSM/I, SSM/T and SSM/T-2) has been consolidated into a single instrument, the SSMIS, built by Aerojet. The SSMIS represents yet another step forward in complexity and capability for a millimeter-wave sensor providing 24 channels spanning from 19 to 183 GHz simultaneously.
Millimeter-wave technology has also been implemented to observe the cosmos. The phenomena are the same: blackbody emissions of the targets resulting from the targets themselves and their specular absorption. Terrestrial radio telescopes are limited in their performance by the effect of atmospheric attenuation and distortion. A space platform above the atmosphere provides a clear view of celestial objects and features. In 1989, NASA launched the Cosmic Background Explorer (COBE) to map the temperature of the cosmos, looking for any possible pattern. One of three sensors, the Differential Microwave Radiometer (DMR), detected broadband noise temperature at 31.5, 53 and 90 GHz with six passively-cooled radiometers. The DMR discovered that there was significant anisotropy over the background, which had not been anticipated. Based on these results, a higher resolution instrument was developed, the Wilkinson Microwave Anisotropy Probe (WMAP), detecting with 23, 33, 41, 61 and 94 GHz. Launched in 2001, WMAP was a collaboration with Princeton and NASA GSFC, and was quite successful at enhancing the resolution of the measurement of the cosmic background anisotropy. NASA launched a series of Small Explorer (SMEX) missions, and in 1998 launched the Submillimeter-wave Astronomy Satellite (SWAS), the first of its kind (see Figure 8). SWAS was a dual-channel spectrometer operating at 490 and 550 GHz, detecting the concentrations of five molecular constituents: O2, H2O, 13CO, C and H218O. SWAS was a wholly collaborative effort: The Smithsonian Astronomy Observatory led the science team; the entire radiometer receiver system was built by Millitech; the spectrometer, an acousto-optical Bragg cell (AOS), was provided by the University of Cologne; and the instrument platform and integration, incorporating a 0.6 m telescope mirror, was built by Ball Aerospace. SWAS discovered a much larger than expected water content throughout the cosmos and was also diverted to observe the atmospheres of Mars, Jupiter and Saturn, as well as take a brief look at the comet C/1999 H1. In all cases, SWAS provided information never before available, some of which contradicted previous theories. Table 1 provides a summary of past millimeter-wave satellite sensors, the spacecraft on which they were used and the detection frequencies.

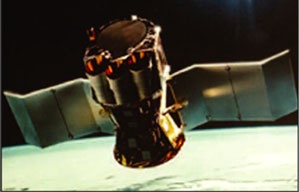
Fig. 8 SWAS(courtesy of Harvard University). 9
Current Systems
There are three major satellite systems currently in development with millimeter-wave sensors on board that Millitech has had involvement with: NPOESS, GPM/GMI and Herschel. Each represents several major steps forward in data gathering abilities.
National Polar-orbiting Operational Environmental Satellite System (NPOESS)
NPOESS is a planned constellation of polar-orbiting satellites that contains several instruments providing data about the earth’s atmosphere, oceans and land (see Figure 9). Polar-orbiting satellites can observe the entire surface of the earth within a short period of time. Because the orbits of these satellites are low compared to geostationary satellites, the data they obtain has improved spatial resolution compared to higher (that is, geostationary) satellites. The broad coverage, coupled with high resolution, will provide continuous data for long-range forecasting and climate modeling. The NPOESS satellites have two instruments with millimeter-wave sensors: ATMS and CMIS. The first NPOESS satellite is scheduled to launch in 2009.

Fig. 9 NPOESS 1330 configuration (courtesy of NOAA). 10
Advanced Technology Microwave Sounder (ATMS)
ATMS, shown in Figure 10, represents the next generation in microwave sounders, with heritage from the AMSU instrument described above. It collects atmospheric data to calculate temperature and moisture profiles with high temporal resolution. This instrument has 22 radiometric channels, 21 of which are millimeter-wave (see Table 2). Temperature and pressure profiles are obtained by observing the complex of oxygen absorption lines from 50 to 89 GHz with 14 channels, and with approximately 33 km resolution. Humidity and precipitation profiles are obtained with six channels observing the region near the water vapor absorption line at 183 GHz, with 15 km resolution. This information will provide improved accuracy for weather prediction models. ATMS can obtain useable data even if the footprint contains significant cloud cover. When the footprint has a minimum amount of cloud cover, ATMS works in conjunction with an infrared instrument, the Cross-track Infrared Sounder (CrIS), to obtain finer vertical resolution.


Fig. 10 ATMS conceptual illustration (courtesy of NOAA). 11
The ATMS channels are reflected by a flat, rotating reflector to a parabolic reflector, and then to a feedhorn. Channels are diplexed into separate channels and amplified by a low noise amplifier (LNA). The outputs of the LNAs are fed through bandpass filters and then to detectors. The signals are then integrated and sent to a signal processor. The types of algorithms used to obtain and retrieve the temperature and humidity profiles are based on the reverse superposition of pressure-broadened spectral lines, as described above. The first ATMS will be launched on the NPP mission in 2006.
Conical Scanning Microwave Imager/Sounder (CMIS)
CMIS, shown in Figure 11, delivers measurements of ocean surface wind speed and direction, sea surface temperature, rain rate, the amount of water in clouds, soil moisture, and atmospheric temperature and moisture profiles. It has 77 channels from 6 GHz up to 183 GHz, with the majority operating near the 60 GHz oxygen absorption line spectrum (see Table 3). CMIS rotates on an axis perpendicular to the ground, observing the surface along semi-circular arcs centered on the ground track. Successive arcs scanned by a single sensor channel are separated by approximately 12.5 km along-track. Calibration data is collected from a “hot” and “cold” scene viewed during a portion of the rotation cycle. The samples fall on one of three main reflector scan-arcs, or, for the 166 and 183 GHz channels, a single secondary reflector scan arc. Sea surface wind direction measurements, a key data product, are also available from CMIS.15 The heritage instrument for this technique is WINDSAT, which was launched in 2003. The amount of blackbody radiation from the sea surface is a function of the water temperature, salinity and roughness. As winds on the surface increase, the surface becomes rougher, which increases the radiation levels. This effect is also a function of the wind direction. Data from the 10 VHLR, 18 VHPMLR and 37 VHPM channels, which avoid the water and oxygen absorption lines and are fully polarimetric, is processed to determine the wind vector. The 6 VH channel is most sensitive to the temperature of the sea surface, so data from that channel is used to calibrate out the error on the higher channels. In a similar fashion, the 23 VH channel is used to reduce the error induced from variations of water vapor above the surface.


Fig. 11 Full scale model of the CMIS instrument (courtesy of NOAA). 13
Global Precipitation Measurement Program/GPM Microwave Imager (GPM/GMI)
The Global Precipitation Measurement Program mission is a multinational effort to research space-based precipitation measurement capability. NASA and the Japan Aerospace Exploration Agency (JAXA) are developing the “core” satellite upon which the GPM Microwave Imager (GMI) will be carried (see Figure 12). The GMI will be a nine-channel microwave radiometer whose measurement frequencies are selected for measurement of rainfall amounts (see Table 4). Like CMIS, it will have a conical scan to provide a large measurement swath (approximately 850 km wide). At 1.2 m, its antenna is smaller than the 2.5 m CMIS antenna, however, GMI will have improved resolution since it will be in a lower orbit at approximately 400 km.

Fig. 12 GMI instrument (courtesy of NASA). 17

Herschel
The European Space Agency (ESA) will be launching the Far-infrared and Submillimeter Telescope (FIRST, later re-named Herschel for William and Caroline Herschel) in 2007 (see Figure 13). One of its instruments, the Heterodyne Instrument for FIRST (HIFI), is a submillimeter, high resolution spectrograph. It will measure radiation coming from the universe at 480 to 1250 GHz and 1410 to 1910 GHz, to study how the early galaxies and stars formed and evolved. While this satellite does its receiving at shorter wavelengths than the millimeter-wave region, it employs mixers as receivers with multiplier chains for the local oscillators, which are techniques normally used in millimeter-wave systems. The receiving system includes 14 LO chains from a common 23.7 to 35.55 GHz signal, with multiplication factors from X18 to X72, and 14 wideband receivers with contiguous bands to cover the extremely wide RF bandwidth. It will also use a 3.5 m mirror, which is the largest of any imaging space telescope.
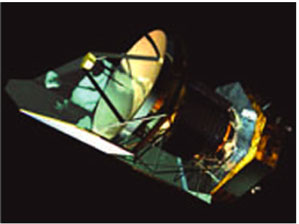
Fig. 13 Artist impression of Herschel (courtesy of NASA). 18
Future Systems
Two major satellite systems now under consideration with millimeter-wave sensors on board are the Geostationary Synthetic Thinned Aperture Radiometer (GeoSTAR) and the Sky Polarization Observatory (SPOrt).
Geostationary Synthetic Thinned Aperture Radiometer (GeoSTAR)
As mentioned above, downward-looking satellites are in low earth orbit. If these kinds of instruments were to be positioned on a geostationary satellite, measurements within its much larger field of view could be made almost instantaneously. However, a conventional reflector antenna would be quite large and heavy if the required resolution were to be maintained from that distance. GeoSTAR (see Figures 14 and 15) would use an array antenna that has elements removed, or “thinned.” The radiometric signals from each element are cross-correlated with each other. The closest pair of elements defines the overall field of view, while the furthest pairs set the resolution. The number of individual receivers and processors are high, but MMIC technology is progressing to the point where this approach becomes feasible. Researchers at NASA’s Jet Propulsion Laboratory are currently developing this concept.

Fig. 14 Prototype GeoSTAR configuration. 19

Fig. 12 Photograph of the GeoSTAR prototype (courtesy of NASA-JPL/Cal Tech). 20
Sky Polarization Observatory (SPOrt)
Like COBE and MAPS before it, SPOrt is a satellite that will map out the cosmic background noise for more detail about how the early universe began to clump together. SPOrt is an Italian satellite which will cover the frequency range of 22 to 100 GHz with a 7° beamwidth and will measure in two polarization states. It is set to fly aboard the ISS later this year.
Conclusion
Millimeter-wave sensors have been used on satellites for the past 33 years and are designed into many of the next generation satellites currently in the development phase. The temperature and moisture altitude profiles from millimeter-wave sensors form the backbone of all the next generation weather forecasting satellites and are necessary for the calibration of microwave radar satellite systems. Future satellites will likely further these roles both by the use of arrays, as in GeoSTAR, and by the use of active systems, as in CloudSat. The same techniques used to monitor the earth will eventually be used in the observation of other planets in the solar system by placing satellites in orbit around them. As the technology used for millimeter-waves continues to expand, the applications for millimeter-wave systems on satellites will expand as well. Millimeter-wave sensors will surely have a home on many future satellites, whether upward- or downward-looking, collecting data for a wide variety of scientific applications.
Acknowledgments
A huge thanks to the contributors of this article: Joe Chandler, Chris Koh and Phil Langlois, and to Kerry Hanley for editing. Also thanks to Karen Lee of JPL for additional information on some of the satellites mentioned.
References
1. http://cfa-www.harvard.edu/swas/swasinstdetails.html.
2. V. Tolls, et al., "Submillimeter-wave Astronomy Satellite Performance on the Ground and in Orbit," The Astrophysical Journal Supplement Series, Vol. 152, May 2004, pp. 137-162.
3. Millitech Inc., Short Form Catalog, 2005.
4. J.F. McCauley, at al., "Subsurface Valleys and Geoarcheology of the Eastern Sahara Revealed by Shuttle Radar," Science, Vol. 218, 1982, pp. 1004-1020
5. http://cloudsat.atmos.colostate.edu/.
6. http://www.earth.nasa.gov/history/nimbus/nimbus5.html.
7. http://www.earth.nasa.gov/history/nimbus/nimbus7.html.
8. http://www.losangeles.af.mil/smc/ci/dmsp/spaceseg.html.
9. http://cfa-www.harvard.edu/swas/saws.html.
10. http://npoess.noaa.gov/technology_NPOESS.html.
11. http://www.ipo.noaa.gov/Technology/atms_summary.html.
12. C. Muth, et. al., "Advanced Technology Microwave Sounder on NPOESS and NPP," http://140.90.86.6/IPOarchive/SCI/sensors/ATMSDraftBrief v4_Alan Webb.doc, 2004.
13. http://npoess.noaa.gov/Technology/cmis_summary.html.
14. http://npoesslib.ipo.noaa.gov/IPOarchives/SCI/sensors/smis/CMIS_CH_SET.pdf.
15. http://www.nrl.navy.mil/content.php?P=04REVIEW87.
16. http://gpm.gsfc.nasa.gov/instruments.html
17. http://gpm.gsfc.nasa.gov/Newsletter/spring05/article2.htm.
18. http://www.esa.int/esaSC/120390_index_0_m.html.
19. B.H. Lambrigtsen, W. Wilson and A. Tanner, "GeoSTAR - A Micowave Spunder for GOES-R," 21st International Conference on Interactive Information Processing Systems (IIPS) for Meteorology, Oceanography and Hydrology, San Diego, CA, January 10, 2005.
20. B.H Lambrigtsen, et al., "A GeoSTAR Progess Report," Jet Propulsion Laboratory, California Institute of Technology, Pasadena, Ca.
Tom Newman earned his BSEE degree from the University of Virginia in 1984, his MSEE degree from Montana State University in 1986 and his PhD degree in EE from the University of Virginia in 1991. He has been with Millitech Inc. since 1991 and is currently the company's chief scientist. Among other projects, he is reponsible for the 166 and 183 GHz millimeter-wave receivers fro CMIS.