
Measurements with pulsed stimulus signals are undertaken for a number of reasons. For instance, in a wide range of applications, devices under test (DUT) must be characterized by using pulsed signals instead of CW signals. Here, the DUT is stimulated either with a pulsed RF signal or the device is put into pulsed conditions by a pulsed control voltage.
For on-wafer measurements of power amplifiers, heat sinks are difficult or even impossible to implement. Using pulsed stimulus signals, S-parameters can be measured at power levels that are used in reality without exceeding the maximum average power that could lead to the destruction of the device. By using an appropriate duty cycle, the average power can be reduced significantly while maintaining a high peak power.
Pulsed measurements require different capabilities of signal detection and signal generation.
There is also the situation where test devices only operate properly with pulsed stimulus, as is the case for components for the mobile communication market (for the GSM standard, for example). Moreover, power amplifiers in mobile phones or radar output stages often only exhibit their desired performance under pulsed stimulus conditions.
Another consideration is that the DUT behavior often changes during the pulse duration. The amplifiers might show overshoot, ringing, or droop versus time. The pulse widths for these applications vary between some 10 ns for radar applications and several 100 microseconds for GSM applications.

What different kinds of pulses are in use? There are periodical single pulses, double pulses, pulse trains, modulated pulses, Barker pulses and dynamic frequency selection (DFS) pulses in accordance with the FCC standard.
Taking these in turn and starting with periodical single pulses (shown in Figure 1), the most common pulsed stimulus signal is a single pulsed RF signal. A periodical single pulse is defined by the following parameters: carrier frequency fc, pulse width ton and pulse period T. Some more specific parameters can be derived:
Duty cycle: Dcycl = ton/T
Pulse repetition frequency (PRF):
PRF = 1/T
The relationship between peak power (Ppk) and average power (Pavg) of an RF pulse is defined by its duty cycle
Pavg = Ppk x Dcycl = Ppk x (ton/T)
Using periodical single pulses reduces the average power while maintaining the peak power by selecting an appropriate duty cycle. Thus, the average power of the DUT can be reduced to a tolerable value to avoid thermal destruction. Other important parameters describing pulsed RF signals are on-off ratio, rise/fall time (typically 5 ns) and pulse width (down to 20 ns).
Double pulses are used in weather, target tracking or astronomical Doppler-radar applications. The double pulse leads to a double echo and these echoes go through signal processing that efficiently eliminates most noise and other interferers. This ensures high measurement accuracy. With double pulses, parameters are the same as for periodical single pulses.
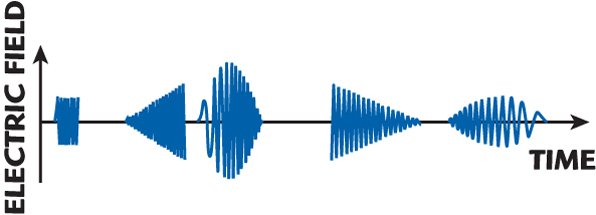
Pulse trains are commonly used for radar applications. An example of a pulse train is shown in Figure 2. In contrast to single or double pulses, ‘pulse trains’ are a combination of different kinds of pulses, which can be a periodical or non-periodical set of pulses. In addition, different modulations can be applied to each pulse or ramp, and the overall pulse shape can be configured freely.
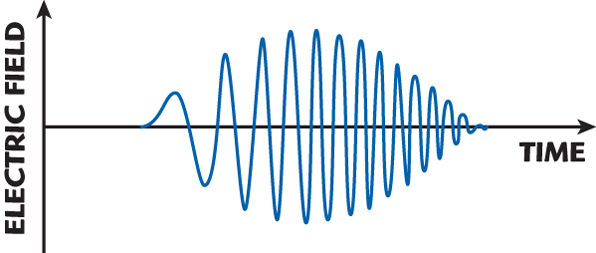
FM modulated pulses, in principle, vary their frequency over time. In an analogy to bird sounds, they are called ‘chirped’ pulses. They can be linearly or nonlinearly chirped. These pulses can also have a specific shape, for example Gaussian, and they can be described mathematically as
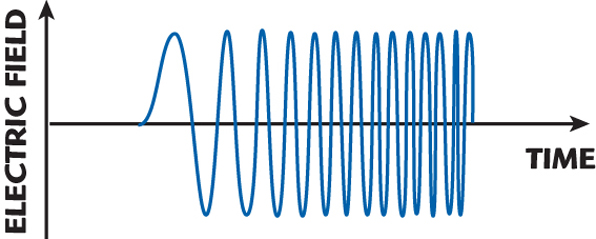
E(t) = ReE0 exp[–(t/τG)2]
exp[i (ω0t + βt2)]
exp[–(t/τG)2]: Gaussian amplitude
ω0: carrier frequency
βt2: chirp
Figure 3 shows the pulse with frequency change over time (chirped pulse), while Figure 4 shows the pulse with frequency change over time and Gaussian shaping.
The next pulse type to be considered is the Barker pulse, which is basically a binary phase shift keying (BPSK) modulated pulsed RF signal. The BPSK modulation is derived from the Barker codes. A bit value of one sets the phase to π, whereas zero bits leave the phase at zero. An additional phase offset may be specified to rotate the constellation points.
This is one signal processing technique used for pulse compression (pulses with inherent modulation applied). In contrast to the analog chirp signal, this signal is digitally modulated. For a high distance resolution, small pulses are normally used. The bottleneck here is the decreasing signal-to-noise ratio. To overcome this problem pulse compression is used for getting wider pulses
with a good signal-to-noise ratio. Figure 5 illustrates Barker codes, and gives an example of a seven-bit Barker code.

There are also dynamic frequency selection pulses in accordance with the FCC standard. For license free data transmission, the 5.25 to 5.35 GHz and 5.47 to 5.725 GHz frequency bands are used, for example, for WLAN applications. According to the FCC standard, Unlicensed National Information Infrastructure (U-NII) devices operating in these bands shall employ a DFS radar detection mechanism to detect the presence of radar systems and to avoid co-channel operation with radar systems.
Currently, two sets of requirements exist regarding the DFS radar detection:
• FCC Part 15 Subpart E
• ETSI EN 301893 V 3.1
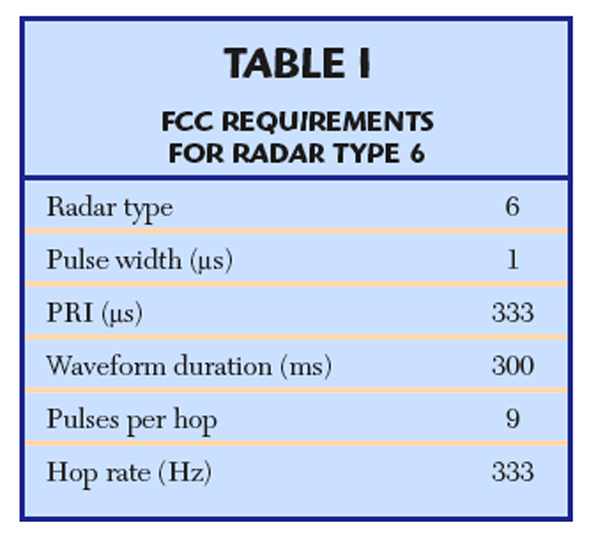
Table 1 shows one example of FCC requirements for Radar Type 6. This waveform type uses a fixed pulse sequence that hops across a wide range of frequencies. It is defined that 100 frequencies are taken within the range of 5.25 to 5.724 GHz. It is not permitted to reuse a frequency. The frequency changes every 3 ms and on each frequency a pulse sequence containing nine pulses is generated. It must be ensured that at least one of the random frequencies falls into the receiver bandwidth of the DUT.
Next, consider how a network analyzer measures under pulsed conditions. The following section describes how DUTs can be analyzed with network analyzers using rectangular pulsed signals.
Point-in-pulse Measurement
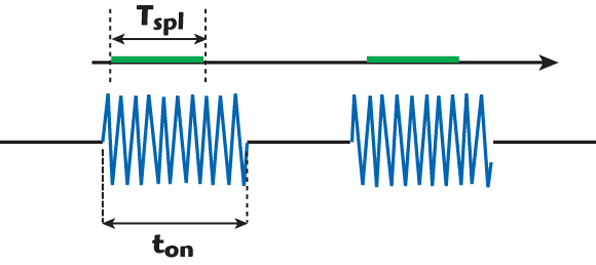
Using the point-in-pulse measurement technique, the pulse is only monitored during the on-phase of the RF bursts. Therefore, it is necessary that the sampling time (Tspl) to acquire the raw data of a wave quantity or an S-parameter is shorter than the pulse width ton (see Figure 6).
The sampling time is mainly determined by the receiver’s measurement bandwidth (IFBw). Theoretically, the relationship between minimum sampling time and measurement bandwidth is
Tspl ≥ 1/IFBw
This means that with increasing measurement bandwidth, sampling time decreases and shorter pulses can be analyzed. For VNAs, the IF filters are implemented as digital filters. Typical VNAs offer measurement bandwidths up to 600 kHz, so that the sampling time is more than 2 μs. Some high end network analyzers that are designed for pulsed measurements offer IF bandwidths up to 5 MHz or more. This results in theoretical sampling times down to 200 ns at 5 MHz bandwidth.
Because the sampling process should only happen during the on-phase of the pulse, a trigger signal synchronous to the RF pulse is necessary to synchronize the data acquisition of the VNA with the on-period of the pulse. The VNA is used in a so called point trigger mode, which means that the data sampling for every single measurement point starts after the detection of a trigger event.
Active devices such as amplifiers often show settling or ringing effects at the beginning of the pulse. Typically the user is not interested in the behavior during this settling time, only when the DUT is settled. By selecting a suitable trigger delay (see Figure 7), the start of the sampling process can be shifted to the quiet pulse roof of the amplifier.

Dynamic range and sensitivity using the point-in-pulse method only depend on the measurement bandwidth of the receivers;
they are independent of the duty cycle of the RF pulse. Therefore, the dynamic range depends on the pulse width itself, because the pulse width determines the sampling time and thus the measurement bandwidth that has to be used. To increase the dynamic range by maintaining the measurement bandwidth, averaging can be applied. Ten times averaging in the IQ domain for example increases the dynamic range by a factor of 10.
Round-up
Advantages
• The point-in-pulse measurement allows accurate S-parameter and power measurements
• The moment of data acquisition within the pulse can be shifted freely
• The dynamic range does not depend on the duty cycle
Disadvantages
• A VNA with a wide measurement bandwidth is required
Average Pulse Measurement
Because the point-in-pulse measurement demands a VNA with a bandwidth that is equal or higher than 1/ton, mid-range VNAs do not support this method for applications with short pulse widths. Here, the average pulse measurement technique (also called narrow band or high PRF technique) is recommended. This method places lower demands on the VNA’s performance, but requires more knowledge to configure the set ups properly, dependent on the pulse and VNA parameters.
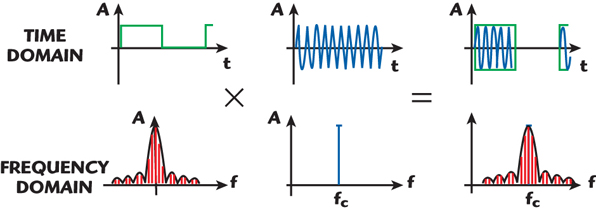
The basic principle is that a pulse signal is generated by multiplying a periodical rectangular signal (pulse envelope or NF signal) that varies between 0 and 1 with a CW signal. The multiplication in the time domain is a convolution of the spectra of both signals in the frequency domain. Signals in the time and frequency domain are shown in Figure 8.
The spectrum of the pulse envelope (NF signal) is shifted by the convolution to the frequency fc. Because S21 = b2/a1 (a1 is the incident wave into a DUT, b2 is the transmitted wave through a DUT) it is then sufficient for S21 measurements to measure
the ratio between one specific spectral line of a1 and the equivalent spectral line of b2. Thus, all S-parameters can be measured. To get the maximum dynamic range, the strongest spectrum line (that is, the main carrier) at fc is selected:
S21 = b2 (fc)/a1 (fc)
S11 = b1 (fc)/a1 (fc), etc.
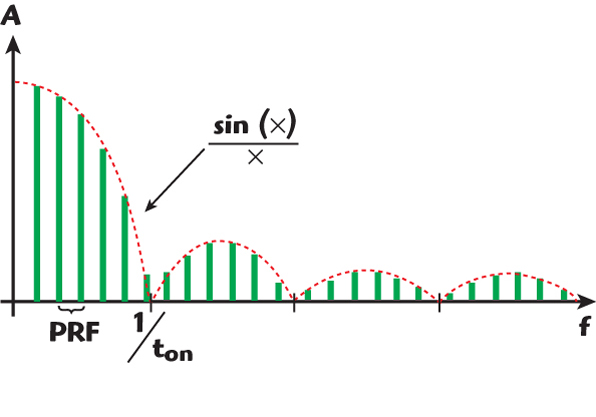
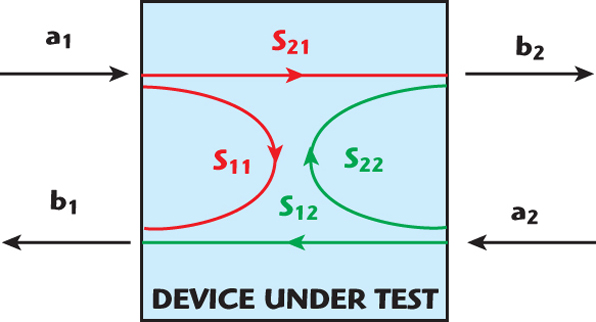
Figure 9 shows the S-parameters of a two-port DUT. For average pulse measurements, it is not necessary to have a very wide measurement bandwidth as required for point-in-pulse measurements, but rather a bandwidth that is ‘narrow enough’ to capture only the main carrier. The frequency spacing between the carriers is equal to the pulse repetition frequency (PRF = 1/T) (see Figure 10).
For a good performance with respect to good trace noise, it is important that the adjacent carriers are suppressed by 40 dB or more. Typically, a measurement bandwidth that is roughly 10 times narrower than the carrier spacing with respect to the pulse repetition frequency is selected. Decreasing the measurement bandwidth means an increase of measurement time:
IFBw < PRF/10
where
PRF = 1/T
IFBw = 1/Tspl
1/Tspl < 1/ (T x 10)
and
Tspl > 10 x T
During several pulses, the VNA samples and measures the average value of the pulse; it is therefore called average pulse measurement. This also becomes clear looking at the frequency domain. With the average pulse measurement method, only the main carrier is detected, which is the convoluted carrier of the NF signal at frequency 0. The carrier at frequency 0 represents the ‘DC value’ of the NF pulse, which is nothing other than the average value of the NF signal.
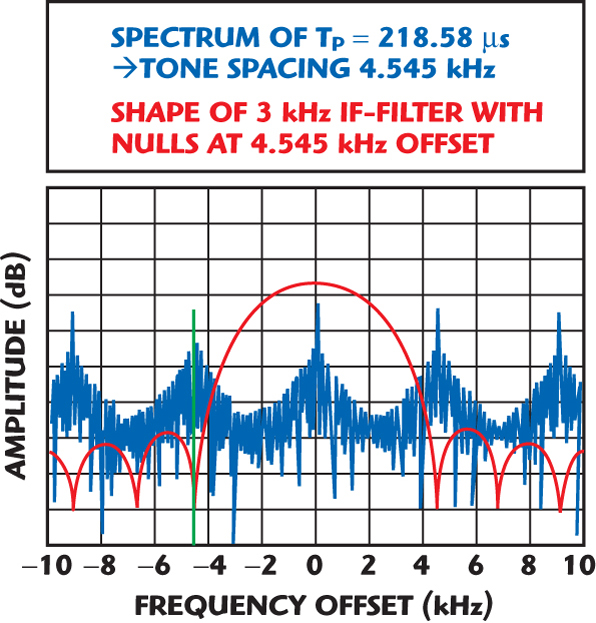
A typical problem for this kind of measurement is the filter shape of the digital IF filters of the VNAs, which typically stimulate the DUTs with non-modulated CW signals. The IF filters are designed for fast settling and not for high side lobe suppression, which is often only 20 dB or even less. This can cause problems as soon as one of the adjacent tones falls into one of the maximums of one of these side lobes.
To overcome this problem, two different procedures can be used. Some mid-range instruments use what is called spectral nulling, shown in Figure 11. Depending on the period of the pulse, IF filters can be selected in a way that the nulls of the filter are exactly where the tones to be suppressed are expected.
In contrast, other VNAs use high selective filters without side lobes, so no spectral nulling is required. Figure 12 shows digital IF filters of VNAs/high selective IF filters of a high end VNA.

Average pulse measurements can be done in a swept mode, too. The set up is the same as for point-in-pulse measurements, but no trigger is required. Because the average pulse measurement technique measures the average values of the wave quantities, an absolute power measurement is influenced by the duty cycle. The measured power is
Pmeas = P x Dcycl2
For a duty cycle of 1 percent, the measured power of the main carrier is 40 dB lower then the peak power. This phenomenon is called pulse desensitization. The power reduction in dB is
For very low duty cycles, the signal-to-noise ratio becomes very low and limits the dynamic range of the measurement.
Round-up
Advantages
• The average pulse measurement technique can be applied on very short pulses
• The VNA does not require a special bandwidth or special trigger capabilities. It is only necessary to directly access the generator path to apply a modulator or a modulated signal source
Disadvantages
In contrast to the point-in-pulse measurement, the average pulse method requires a periodical pulsed signal
• The results represent only average values and therefore also include ringing or overshoots that might happen at the beginning of a pulse
• The IF filters of the VNA must be able to suppress other signals except the main carrier. This requires IF filters without side lobes, or a suitable selection of IF filter shapes dependent on the pulse repetition frequency of the pulse
• The dynamic range drops by 20 dB as soon as the duty cycle is reduced by a factor of 10, which can result in poor performance for low duty cycles. In these cases a point-in-pulse measurement is recommended
Pulse Profile
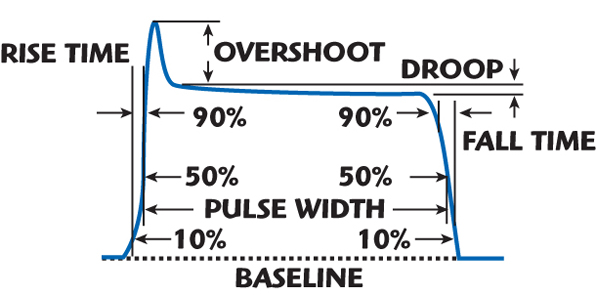
To analyze the time dependent behavior of a DUT during a burst, the VNA has to perform a so-called pulse profile measurement. Typical parameters to characterize the time dependent behavior are rise time, overshoot and droop.
For this measurement, the VNA must feature a time resolution that is significantly higher than the pulse duration. A typical VNA’s time resolution ranges from 3 to 20 μs for measurements in the frequency or time domain. That is not high enough to analyze the behavior versus time with sufficient resolution. Figure 13 shows a representative pulse waveform.
Chopping Principle
Most VNAs have a measurement bandwidth of 600 kHz or less, which is the limitation factor for high time resolution of pulse widths of 1 μs or below. To achieve resolutions of 100 ns and below, additional external hardware and software can be used to ‘chop up’ the pulsed signal into slices with different timing positions within the pulse (see Figure 14).
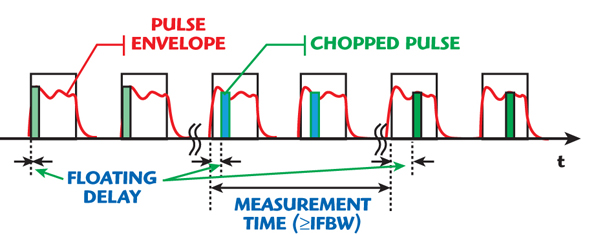
The magnitude of these pulse slices with regard to a certain delay is measured and calculated off-line in accordance with the average pulse method. The delay is then increased and the next ‘slices’ are measured until the desired duration of the pulse is analyzed. The chopping can happen either in the receiver paths on the RF frequency or directly inside the instrument on the IF path. If the IF is chopped, the losses of the necessary switches can be minimized.
Round-up
Advantage
• Can be done with most VNAs in conjunction with external setup for pulse profile measurements
Disadvantages
• No analysis of non-periodical pulses, double pulses, pulse trains or complex modulated pulsed signals
• Low dynamic range for low duty cycles and high resolution
• Low measurement speed
• Change of duty cycle requires recalibration
• Difficult to operate
Wideband Detection
A new approach is wideband detection with fast data recording. The performance for pulse profile analysis of pulsed signals or S-parameters with pulsed stimulus is limited by the sampling rate of the A/D converter, the processing time between two data points and the available bandwidth; sampling rate and data processing time between two data points limit the time resolution, while the measurement bandwidth determines the minimum rise and fall time of the pulse that can be analyzed.
The bandwidth limiting factors are the analog bandwidth of the receivers and the capabilities of the digital signal processors (DSP) for digital filtering. A high end VNA has an analog bandwidth of 15 MHz (with some performance degradation of 30 MHz), but the DSP’s IF filters only offer adequate performance for normal CW or time sweeps with 5 MHz bandwidth. The VNA samples down converted IF signals at a sampling rate of 80 MHz, which results in a time resolution of 12.5 ns.
In addition to the sampling time, there is a data processing time between two measurement points, which is a bottleneck when it comes to high resolution measurements in the time domain. The limitations are the IF filtering by the DSPs with maximum rise and fall times of 1/(5 MHz) = 200 ns, and the data processing time limiting the time resolution to 1.5 μs + sampling time.
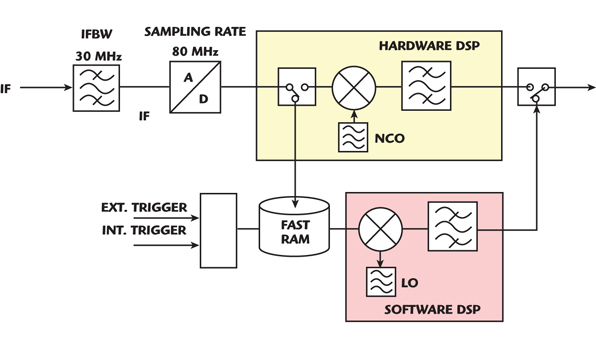
With a new approach, performance for pulse profile measurements is dramatically improved. The sampled raw data is directly stored without filtering. Instead of the DSP, the instrument’s software performs digital down conversion and digital filtering after recording. Figure 15 illustrates fast data recording.
The A/D converter continuously digitalizes the data with a sampling rate of 80 MHz and writes them into fast RAM. This ensures that no delay occurs between the samples of individual measurement points. Because of the high sampling rate, a measurement point is output every 12.5 ns, that is, the time resolution is 12.5 ns.
The trigger signal, usually derived from the rising edge of the pulse, determines the zero point in time. Thus, the exact time relationship between the trigger detection and the incoming RF pulse can be measured too. This relationship is especially important for determining the correct trigger delay in point-in-pulse measurements versus frequency or level (see Figure 16).
Owing to such a progressive method, a VNA is able to perform extremely fast-pulsed measurements. With more than 10 sweeps/s at 1001 test points, DUTs can easily be adjusted during the pulse profile measurement. In addition to periodical single pulsed signals, this new technique handles double pulses as well as user-defined pulse trains. DUTs stimulated with pulses that have frequency and magnitude modulation, for example, chirps, can also be analyzed.
Group Delays
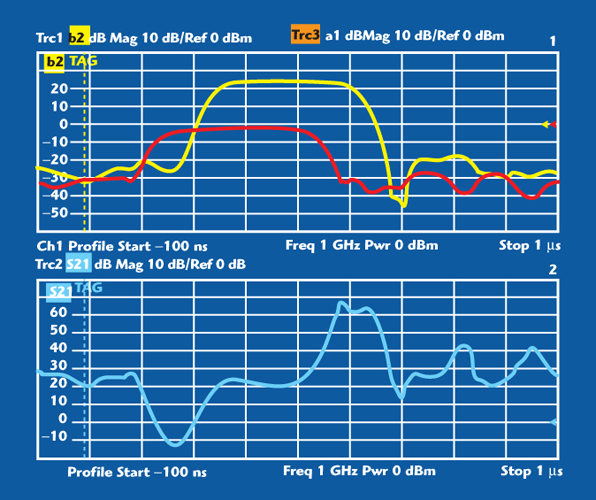
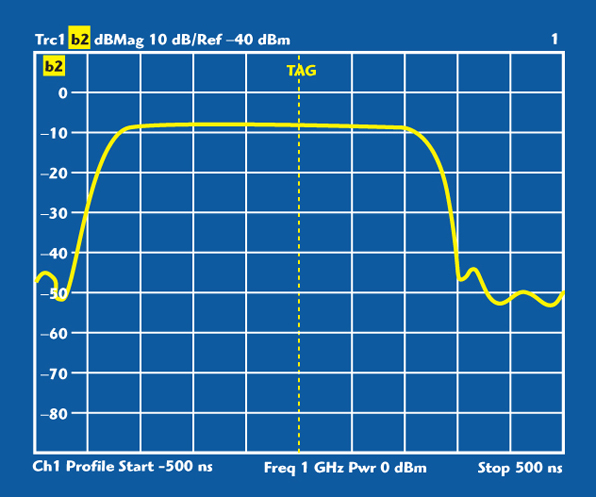
Measuring the S-parameters of DUTs with group delays in the range of the pulse width is often difficult or even impossible. The stimulated RF signal may no longer be present at the DUT’s input by the time the VNA receives the transmitted RF signal from the output. A correct S21 parameter can only be measured with temporal signal overlapping. Figure 17 shows a measurement of wave quantities and S-parameters of a DUT with a group delay of 100 ns.
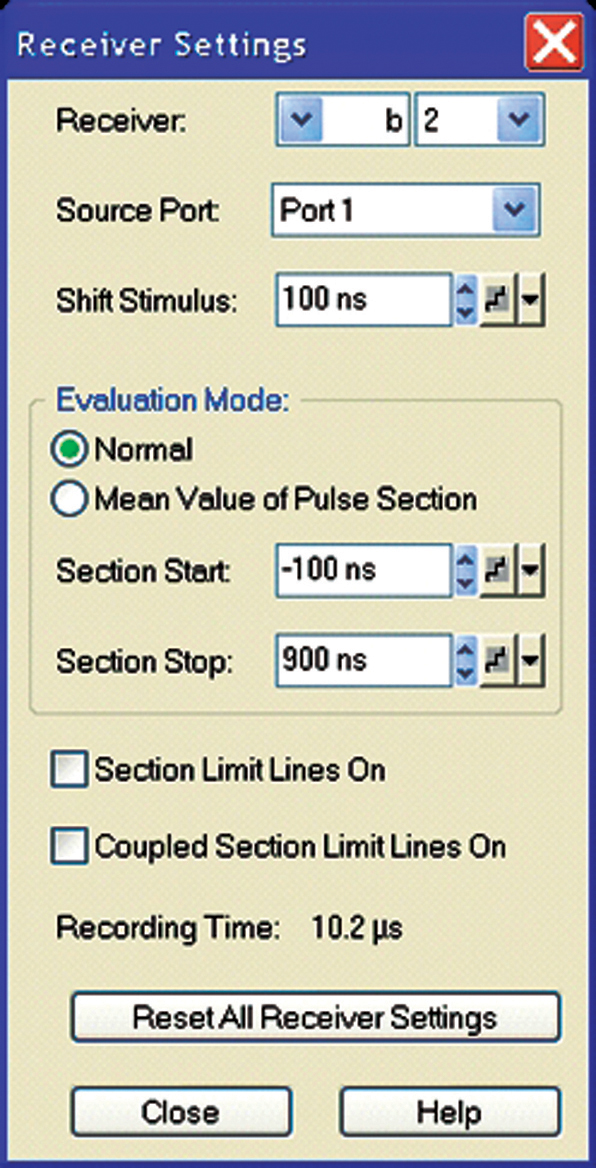
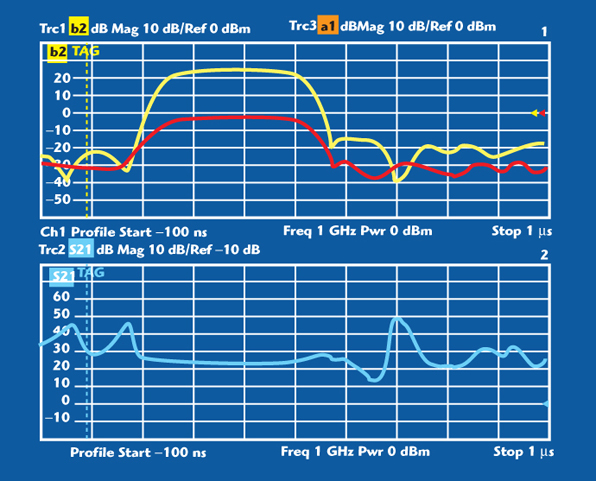
A VNA solves this problem by applying a time offset to the wave quantities: before calculating the S-parameters, it mathematically shifts the wave quantities by the DUT’s group delay. A specific time delay can be assigned to each wave quantity, depending on the measurement direction (see Figure 18), so the VNA correctly displays the gain S21 versus the entire pulse duration (as shown in Figure 19).
Round-up
Advantages
• Analysis of single non-periodical pulses
• Analysis of pulse trains and double pulses
• Analysis of pulses with modulation
• High time resolution
Signal Generation
Most VNAs cannot modulate the internal generator with sufficient performance. It is therefore more convenient and versatile to use external modulation sources, especially for very complex pulse scenarios. In most cases, pulses range from less than a microsecond to several hundred microseconds and carry data in various modulation schemes. Additionally, a limited spectral bandwidth may call for dedicated pulse shaping and often requires high on-off ratios.
The generation of these pulse signals is therefore not a trivial task, and simple CW pulses from analog microwave sources are sometimes not sufficient to fulfill testing needs. Today’s powerful vector signal generators are generally the best choice for the generation of arbitrary pulses containing digitally modulated data content. The arbitrary waveform (ARB) mode of these instruments provides enough memory and high resolution for complex and long pulse trains.
With flexible software for vector signal and baseband generators, the generation of complex pulse patterns used in communication or military applications can be dramatically simplified. In addition, the precalculated results (for example, FFT) can be displayed on a screen and directly compared with real measurements on a VNA.
The following section compares the capabilities of analog microwave generators with those of vector signal generators. An analog source contains a pulse modulator and a pulse generator. The pulse modulator is driven by the pulse generator with a square signal. In principle the pulse modulator is a simple switch that activates and deactivates the RF. The main advantage of this concept is the capability of generating very short pulses in the range of nanoseconds with an excellent on/off ratio. The bottleneck is that the capability to apply specific shaping of pulses or to modulate them is missing (for example, Chirp, Barker).
Aimed at a specific modulation in a pulse or a user defined pulse train, a vector signal generator is the only choice for generating those kinds of signals. It takes a precalculated pulse waveform, which is stored in the internal arbitrary waveform generator and generates this waveform cyclically. The waveform is then up-converted to the desired RF frequency by an internal IQ modulator. In contrast to a normal pulse modulator/generator solution, this concept offers great variety and flexibility in setting up pulse scenarios or pulse trains.
By using external software the complete pulse scenario set up is simplified. Pulse parameters can be set in a versatile way and the settings can be controlled on FFT, vector plane or time plan displays. This becomes important especially for the previously described FCC pulse scenarios. The DFS-FCC radar types can be directly selected so the failure probability of a wrong set up is negligible. Limitations of a vector signal generator can be the limited on/off ratio and the minimum pulse width, depending on the internal IQ bandwidth.
At a Glance Comparisons
Analog Signal Generator with Pulse Generator and Pulse Modulator
Advantages
• High pulse on-off ratios (> 80 dB)
• Very short rise and fall times (< 5 ns typical)
• Very short pulse widths (> 20 ns)
• RF frequencies up to the microwave range
Disadvantages
• Limited pulse shaping
• Generation of modulated pulses is not possible (e.g., Chirp, Barker, etc.)
• Generation of complex pulse trains is not possible
Vector Signal Generator
Advantages
• Customized pulse shaping and modulation
• Arbitrary pulse trains
Disadvantages
• Limited on-off ratio (limited by the ARB dynamic). The full dynamic range of a vector signal generator’s ARBs provides a total of 16 bits for both I and Q signals. The theoretical dynamic range is 96 dBc. In practice, however, the dynamic range is limited to approximately –65 dBc. To overcome this problem, an internal marker signal can directly drive the pulse modulator of the vector signal generator. This gives a dynamic range of more than 80 dBc.

• Longer rise and fall times and pulse widths (limited by the IQ bandwidth). The minimum pulse width is determined by the IQ bandwidth of the instrument. For a given IQ bandwidth of 100 MHz, for example, the minimum pulse width should be at least 1/(3 x 100 MHz), which equals 3.3 ns.
Test Set Ups
For applications where the DUT requires a pulse-modulated input signal, a generator with pulse modulation or a vector signal generator for complex waveforms can be used. The modulated RF signal of the generator is directly injected into the generator path of the VNA instead of using the non-modulated internal VNA generator (as shown in Figure 20).
Because the modulated signal is also measured by the reference receiver when it passes the internal coupler, system error correction can be applied on S11 and S21 measurements. A system error or level calibration recorded under CW conditions thus applies under pulsed conditions and needs not be repeated when the duty cycle is changed. As the VNA controls power and frequency of the external generator via LAN or IEC/IEEE bus, this set up is suitable for pulsed measurements versus frequency and level.
For measurements with simple RF pulses, a pulse modulator can be inserted into the generator path enabling bidirectional measurements and thus also two-port calibrations. With a modulator applied in the generator path of port 1, the forward parameters S11 and S21 are measured under pulsed stimulus conditions and the reverse parameters S12 and S22 under non-pulsed stimulus conditions. Only an additional arbitrary waveform generator is required for a pulsed DUT (as shown in Figure 21).
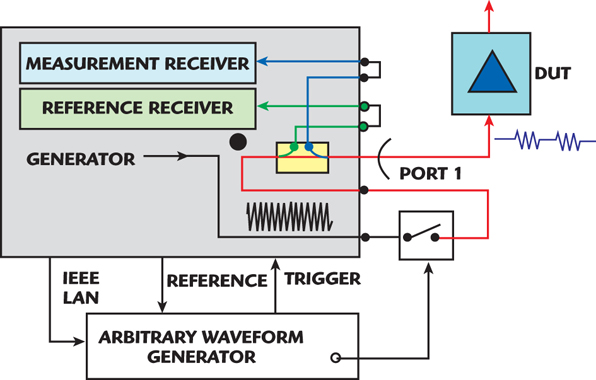
Neither the set up with external pulsed signal generator nor with external modulator requires recalibration if the duty cycle is changed. A calibration performed in CW mode is also valid under pulsed conditions. This set up allows an accurate, calibrated measurement of S-parameters as well as accurate calibrated measurements of absolute power levels.
Conclusion
Pulsed measurements require different capabilities of signal detection and signal generation. For simple tasks, for instance when measuring the S-parameters of a DUT that has no influence on the shape of the pulse, an average pulse measurement with a standard network analyzer and the capability to modulate the source may be sufficient. However, if the user has to measure the S-parameters and absolute power levels with very low duty cycles, or if the pulse shape is influenced by the DUT, he or she requires a point-in-pulse measurement with a network analyzer with high measurement bandwidth and short sampling times.
Measuring the time dependent behavior of a DUT during the pulse requires pulse profile measurements with a high end network analyzer. Ideally, the instrument provides a very wide measurement bandwidth, a high sampling rate and special features for continuous data recording. To generate periodical pulse modulated RF signals, a simple switch driven by a suitable pulse generator is sufficient. An off-the-shelf solution would consist of a microwave generator with inbuilt pulse capabilities that can also be controlled directly by the network analyzer for swept measurements versus frequency or power.
Pulse trains with additional modulation besides the pulse modulation require a vector signal generator with internal I/Q modulator. For generating pulse trains, a high performance vector signal generator must be used. Therefore, a high clock rate and a large memory in the baseband, as well as a wide I/Q modulator bandwidth, are essential.
 Frank-Werner Thümmler earned his master’s degree in electrical engineering from the Technical University of Karlsruhe. From 1994 to 1999, he worked as a product manager for EPCOS before joining Rohde & Schwarz. He is currently product manager for vector, analog and arbitrary waveform generators, microwave signal generators and power meters.
 Thilo Bednorz received his master’s degree in electrical engineering from the Technical University of Munich. From 1990 to 1993, he worked in the spectrum analyzer group of Rohde & Schwarz. Since 1994, he has been working in the network analyzer group.