
I. Introduccion

Dual Ridged Horns have been analyzed recently in [1]. The work showed the problems with the integrity of the main lobe of the pattern that these types of horns have. While the work on improving these horns has been concentrated primarily on the 1 to 18 GHz [2] models DRHA also cover other frequency ranges. The 200MHz to 2GHz range DRHA are the required antenna in the Mil Std 461E for both emissions and Immunity in the 200MHz to 1GHz range.

Measured data of the Gain suggests that there are also pattern issues on these types of horns. Figure 1 shows the typical gain for a 200MHz to 2GHz DRHA.
It is of interest the sudden drop in gain at the upper end of the frequency range. The Gain drops from a 9dB average to 3.5dB between 1900 and 2000MHz. This is similar to the drop in gain seen in the 1 to 18GHz models between 16 and 18GHz. To get a better idea of what is causing the drop in gain a 200MHz to 2GHz DRHA was placed in an antenna pattern measurement taper chamber.
The antenna pattern was then measured using EMQuestTM data acquisition and analysis software. Using this software the antenna under test is rotated inside the quiet zone of the chamber and the radiation is measured with a receive antenna.

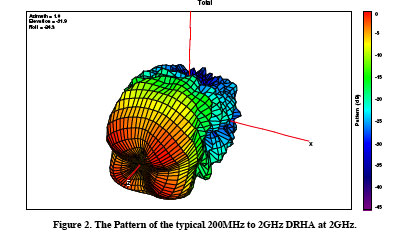
The software measured both principal polarizations simultaneously with the aid of a dual polarized antenna. The software then generates a 3D view of the radiation pattern. Figures 2, shows that there is a notch or split in the main beam (the main beam breaks into 4 separate beams) of the pattern, which causes the drop in gain at the upper end of the frequency range.
The main purpose of this paper is to find a solution to this problem and therefore to improve the performance of this classic antenna.
II. Numerical Modeling.
There are a lot of computational electromagnetic (CEM) tools available in the market today. These tools allow the antenna engineer to design antennas and to check the effects of changes to the structure without the need of building prototypes. MW studio was chosen as the software package to simulate the DRHA. This software is a time-domain approach software which will provide solutions over large frequency spans after one single execution. This makes it ideal for the analysis of DRHA.

The Software package showed that is can provide accurate predictions of the performance of these horns as it was seen in [4] and [5]. The first step is to create a model that will recreate the issues measured and shown in figure 2. The mechanical drawings for at 200MHz-2GHz DRHA are used and a model is constructed within MW studio. Figure 3 shows a picture of this model.
The metal parts of the antenna are modeled as perfect electric conductor. The structure is fed via a coaxial cable. To reduce the number of unknowns in the simulation a symmetry plane was used in the E-plane of the antenna. This is the plane along the ridges. The structure was simulated and the pattern at 2GHz.

At this point a study of the feed was performed. The behavior that the pattern exhibits is caused by a different mode being excited on the feed cavity. As this mode radiates it produces the split patterns observed in figures 1 and 4. Figure 5 shows the feed of the antenna and the excited mode.
The feed cavity was modified by adding some reflective structures. The purpose of these strucutures was to maintain the radiating mode that radiates a single lobe. Figure 6. shows the cavity with these structures and the new radiating mode at the feed.
While in the mode in figure 5 we can see the field being stronger between the ridges and the sides of the cavity, in the new feed cavity (shown in figure 6) we observe the field oriented between the two ridges. Figure 7 shows the new pattern at 2GHz.

The plot in figure 7 shows no split in the pattern. The next step was to fabricate prototypes to verify the predictions of the model.
An additional, test was done, in which the DRHA was place in front of itself at a distance of 1m as in the SAE ARP 958 calibration approach. For this case an additional plane of symmetry was used to reduce the unknowns needed to solve the problem. So the horns are fed with a gap source at the location of the coaxial probe. Figure 8 shows the geometry and figure 9 shows the gain and compares it with measurements.
III. Measurements.

Although the model shows that we have a solution there are limitations to the numerical model, mainly from the assumptions done in the creation of the model. The model results can be validated by measuring the performance of the prototypes. Figure 9 shows the comparison of the gain measured per the SAE ARP 958 approach and the computational results obtained from the set up in figure 8.
The plot shows a difference between the computed and measured at the low end where it may be explained by the limits of the boundary condition but over all there is a less than 2dB difference between the measured gain and the computed gain from the MW studio simulation.

The final step is to verify that the pattern has improved as predicted by the software. For that purpose the antenna was measured in the taper chamber. Figure 10 shows the measured pattern created by the EMQuest data acquisition software. It is clear that as predicted by the software the pattern remains in a single lobe at 2GHz.
Figure 10.Measured pattern of the 200MHz to 2GHz improved DRHA at 2GHz. From the pattern data EMQuest can extract the beamwidth of the antenna as well as directivity and side lobe level and any other pattern related parameters. Both the computed and measured data have shown that the pattern has improved at 2GHz, and with it should have come an improvement in the gain of the antenna. The improvement can be seen in figure 9 where there is no drop in gain as wee approach 2GHz. Figure 11 shows the actual improvement in gain when compared with the traditional 200MHz to 2GHz DRHA.

From the plot, we can see a 6dB improvement in gain at the 2GHz point. The result is an antenna with a better amplifier power use when generating fields for immunity purposes.
IV. Conclusion
The measured and computed results both agree that with a change to the feeding cavity of the antenna we have improver significantly the performance of the antenna. Not only have we manage to get a much higher gain and better illumination pattern at the 2GHz point but the improvement at 2GHz opens the possibility for this 200MHz to 2GHz DRHA to be used to higher frequencies.
V. References
[1] C burns, P. Leuchtmann, R. Vahldieck, “Analysis and Simulation of a 1-18GHz Broadband Double- Ridge Horn Antenna”, IEEE Transactions on Electromagnetic Compatibility, Vol 45, No 1, pp55-60, Feb 2003.
[2] V. Rodriguez, “A new broadband Double Ridge guide Horn with improved Radiation Pattern for Electromagnetic Compatability Testing”,16th international Zurich symposium on Electromagnetic compatibility, Zurich, Switzerland, February 2005.
[3] MIL-STD-461-E “Requirements for the Control of Electromagnetic Interference Characteristics of Subsystems and Equipment” Department Of Defense, August 1999.
[4] V. Rodriguez, “Design of An Open-Boundary Quad-Ridged Guide Horn Antenna Using a finite integration time domain technique” 22nd Annual Review of Progress in Applied Computational electromagnetics (ACES 2006), Miami, Fl, March 2006.
[5] V. Rodriguez, “An open Boundary Quad-Ridged Guide Horn Antenna for Use as a Source in Antenna Pattern Measurement Chambers” IEEE Antennas and Propagation Magzine, Vol. 48, No. 2, April 2006, pp. 157-160