RF signals are undergoing dramatic changes as a result of the digital RF revolution. The RF spectrum is becoming increasingly crowded as wireless devices multiply.

Marcus daSilva received his BS and MS degrees in electrical engineering from the University of Missouri-Rolla. He has held various engineering, management and marketing positions at Hewlett-Packard and Agilent over a 23-year period, and made contributions in frequency synthesis, test methodologies, device modeling, microwave component design and metrology. He was vice president of engineering and chief technical officer at Vivato, where he assembled and managed the team that developed the industry’s first WiFi switch. He is currently principal engineer and manager of strategy and advanced technology, RF products, at Tektronix Inc.
Data is replacing analog signals as the primary payload and there is a race to design efficient modulation and coding schemes capable of sending an ever-increasing number of bits over the same valuable bandwidth. While traditional transmissions were continuous and tended to occupy a single frequency channel, the new digital transmissions tend to be packet-based and often employ frequency hopping or have dynamic channel assignments. These changes in the RF signal environment have driven requirements in the test equipment used by those who design, build, install or service RF systems. This article explores how dynamic range and bandwidth, key specifications for equipment designed to test and measure RF signals, need to be re-examined.
Signals with Short Duration and Random Timing
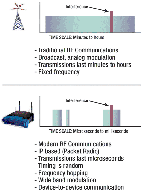
Consider the two cases illustrated in Figure 1. In each case, there is a short burst of interference lasting a few milliseconds. The analog signal in the upper part of the figure has duration of several minutes. A single short-duration interfering signal may cause a pop or glitch in the reception, without changing the nature of the signal being received. The digital RF signal in the lower half of the figure transmits data packets. Each packet is sent in the form of an RF burst lasting a few milliseconds. The same interfering burst that caused barely a glitch in an analog radio signal causes the irretrievable loss of a number of transmitted symbols. The entire packet is lost if the number of lost symbols exceeds the ability of error correction algorithms to recover them. The need to detect, measure and analyze short-duration signals is changing the test equipment requirements. It is no longer enough to have sufficient bandwidth to demodulate a signal and enough dynamic range to separate weak signals from much stronger ones. It is necessary to detect, capture and analyze signals with increasingly short duration and random timing that occur in the presence of other, often much larger signals, each of which is also changing with time.
Dynamic Range and Bandwidth for Steady-state Signals
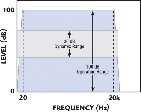
Dynamic range is the ability of receiving systems to detect small signals in the presence of larger ones. In the human ear, for example, the difference between a weak sound pressure at the threshold of hearing and a strong sound pressure at the threshold of pain is approximately 100 dB. The ear’s ability to distinguish between two sounds that are present simultaneously is approximately 30 dB, reflecting the reality that a human is unable to hear a pin drop during a rock concert. Human hearing has an operating range of 100 dB and a dynamic range of 30 dB, as shown in Figure 2.
The frequency range of an RF analyzer defines the minimum and maximum frequencies that can be processed by a particular system. Its analysis bandwidth defines the portion of the spectrum that can be simultaneously analyzed. RF receivers, including spectrum analyzers (SA) and vector signal analyzers (VSA) operate on an analysis bandwidth that is a bandpass function surrounding a center frequency. The analysis bandwidth of SAs and VSAs is typically much narrower than their frequency range. Spectrum and vector signal analyzers are available in many performance levels. Frequency ranges run from DC to more than 300 GHz with a variety of specified bandwidth and dynamic ranges.
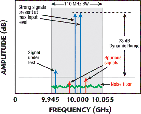
A dynamic range of 80 dB at 28 MHz bandwidth and 73 dB at a bandwidth of 110 MHz define the state-of-the-art at the time of this publication. Figure 3 illustrates the dynamic range and analysis bandwidth of a VSA. Signals within the 110 MHz analysis bandwidth can be examined simultaneously. Multiple signals present within the analysis bandwidth can be unambiguously resolved as long as their relative levels are within 73 dB, the specified dynamic range. The analyzer, in this example, has enough over-range capability to accommodate the peak addition of the two large signals.
All signals present are assumed to be of steady state. The steady-state dynamic range and bandwidth are the principal attributes that define the performance of an analyzer used to measure signals from traditional communications systems. These attributes, however, are not enough to define performance when measuring digital RF signals, where transmissions are sent in asynchronous bursts and interfering signals with exceedingly short durations can cause data packet errors. Therefore, it is necessary to consider an analyzer’s ability to detect RF bursts and transients in the presence of larger signals that are themselves changing over time.
Digital RF Signals
Consider the spectrum versus time plot shown in Figure 4. The time record shows two regularly occurring digitally modulated RF bursts occupying the lower half of the displayed frequency span. Each burst lasts 50 ms (one shown partially). The plot also shows a continuous signal in a neighboring channel and a single interfering burst of RF lasting 25 μS. Both the burst and the continuous signal are more than 45 dB lower than the stronger modulated signal. The interferer occurs so infrequently that it can be considered a single event. These hypothetical digital RF signals will now be applied to several classes of equipment in an attempt to discover the lone interfering burst of RF and to analyze its contents.
Transient Discovery
Often, the toughest problem in troubleshooting digital RF signals is discovering the transients that degrade data transmissions. The short duration of digital RF signals, their unpredictable timing and the wide range of levels that can occur simultaneously make transient interference problems difficult, time consuming and frustrating. Once a transient signal is discovered, it must be analyzed. Triggering on the transient occurrence allows a time record of the waveform containing the signal of interest to be captured and subsequently analyzed using the powerful digital signal processing tools available in most modern analyzers.
Transient Discovery with Swept Spectrum Analyzers

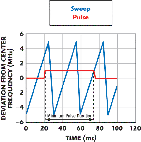
Consider, for example, a swept spectrum analyzer, as shown in Figure 5 with a 75 dB dynamic range, 25 ms sweep speed, a retrace time of 5 ms and a frequency span of 40 MHz about an arbitrary center frequency. Even though the MAX Hold function can catch and display a single occurrence, a transient signal must be present for the entire sweep for its spectrum to be displayed accurately. The random timing of the burst relative to the sweep means that the minimum burst duration for 100 percent probability of discovery is twice the sweep time plus the retrace.
The minimum signal duration to guarantee that the correct spectrum is displayed in the example is 55 ms for a burst of RF with random timing. The swept spectrum analyzer can be said to have a single event dynamic range of 75 dB with minimum duration of 55 ms for 100 percent probability of detection. The swept spectrum analyzer can easily show the continuous signal shown previously. The 50 ms pulses have a repetition rate that is frequent relative to the sweep speed, causing their pulse spectrum to be displayed on the swept spectrum analyzer screen. However, the single 25 ms burst is much too short to be displayed with any certainty.
Transient Discovery in Vector Signal Analyzers
Figure 6 shows a simplified block diagram of a vector signal analyzer. The input signal is down-converted and a passband of interest is digitized. The digitized samples are placed in memory. The contents of the sample memory are then analyzed. Digital signal processing (DSP) software makes many kinds of analysis possible, including spectrum, modulation, timing and signal statistics. This flexibility comes at the price of processing delay. The DSP algorithms, typically running on a programmable processor, cannot keep up with the incoming signal causing gaps in the analysis record. It should be noted that several models offer swept spectrum analysis and vector signal analysis in that same package. This article will treat them separately for simplicity.
Consider the VSA shown, with a 40 MHz analysis bandwidth, a 100 MHz sample rate and 75 dB dynamic range. Even if a fast Fourier transform (FFT) only requires a 20 ms time record, the computations take several milliseconds. The minimum duration for computing the spectrum of an RF burst with random timing is twice the acquisition length plus the computation gap.

The VSA in this example requires a minimum transient duration of 10 ms for 100 percent probability of discovery of a single transient. The VSA in this example can catch the regularly occurring modulated signal and correctly show its spectrum. It will also correctly show the spectrum of the continuous signal. The probability that it will catch the single transient, however, is very small.
Transient Discovery in Real-time Spectrum Analyzers
Consider the real-time spectrum analyzer (RTSA) architecture illustrated in Figure 7. Like the VSA, the RTSA digitizes a wide bandwidth IF signal. The RTSA, however, places a real-time processor after the ADC. The real-time processor is capable of performing digital Fourier transforms (DFT) at a rate that keeps up with incoming signals, reducing or eliminating the processing gap and even allowing for overlapped DFTs. This ability to analyze signals without having to post-process the contents of the sample memory gives the RTSA the unprecedented ability to discover rare short-duration RF events.
The ability to continuously perform Fourier analysis with minimum processing gaps allows the real-time spectrum analyzer to provide a live display of the input spectrum. Variable persistence, also called digital phosphor or DPX processing, enables users to visualize the changes in the spectrum of the input signal while providing an indication of how often spectral events occur. Setting the persistence to infinite allows the discovery of single events.

The real-time spectrum analyzer shown has a 110 MHz real-time analysis bandwidth, a specified 73 dB dynamic range and a minimum signal duration of 24 μS for a 100 percent probability of discovery using its DPX mode. The real-time spectrum analyzer is thus able to display all three of the signals present in the original example and to indicate the presence of the single transient event, correctly displaying its spectral components.
Triggering
Triggering systems are used to facilitate signal analysis by allowing the user to selectively capture only the time segment of a signal that contains an event of interest, the trigger event. Modern triggering systems are capable of storing a time record of events that leads to the trigger as well as what happens after it. Once the waveform of a signal is captured into analysis memory, the full power of DSP can be used to analyze any and all of its relevant parameters.
Level Triggers in Oscilloscopes
Oscilloscopes have very complex and fast triggering systems that cover the oscilloscope’s bandwidth and vertical range. The dynamic range over which the oscilloscope can trigger on short-duration signals is limited by the ability of its triggering system to detect changes in a waveform produced by the occurrence of a low level transient on top of an existing waveform. The peak voltage displayed on an oscilloscope will vary by 10 percent or approximately 1 dB when a burst containing another sinusoid of 20 dB lower level is added to a constant sinusoidal signal. Noise, modulation and other signal variations further limit the effective dynamic range of a level trigger.
Although the trigger range of the typical oscilloscope covers its entire vertical resolution, the ability of the oscilloscope to trigger on a weak signal in the presence of larger ones varies from approximately 20 dB for noiseless unmodulated signals to 0 dB for signals with complex modulation or poor SNR. The oscilloscope can easily trigger on the large RF bursts. Its low steady-state dynamic range places the oscilloscope noise and distortion floor at about the same level as the other two signals, making the capture and analysis of the other two signals unlikely and inaccurate at best.
Level Triggers in Spectrum Analyzers and Vector Signal Analyzers

Figure 8 illustrates a power versus time display available on many spectrum analyzers and vector signal analyzers. Like oscilloscopes, modern SAs and VSAs have the ability to trigger on the composite level of the signals present in their IF. While the operating range of the level trigger can be quite large, the ability to trigger on a weak signal in the presence of stronger ones is much more limited. Like an oscilloscope, a 20 dB trigger dynamic range is a reasonable estimate for triggering on the composite level of two unmodulated carriers.
The dynamic range degrades significantly for signals with noise or complex modulation. The VSA shown previously (see Figure 6) can easily trigger on the larger pulsed signal and analyze its contents. Its dynamic range allows it to show the continuous signal as well. The spectrum of the single interfering burst, however, will only be shown correctly if it happens to coincide with the capture interval of the analyzer. Therefore, the probability of capture is very low.
Frequency Mask Trigger in Real-time Spectrum Analyzers
Advances in digital signal processing and computational hardware have enabled real-time spectrum analysis. A real-time spectrum analyzer computes Fourier transforms at a rate that keeps pace with the incoming signal. This enables the direct observation of how frequency components of a signal change over time. It also enables triggering in the frequency domain and dramatic improvements in the ability to trigger on small signals occurring in the presence of larger ones. The digital Fourier transform used in frequency mask triggering separates the various components of the incoming waveform with a high dynamic range.
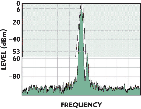
Consider the case of a small intermittent interferer in the vicinity of a much larger signal, as shown in Figure 9. The interferer lasts 25 ms and, at 47 dB below the larger signal, is too small to be captured by power or level triggers. A real-time spectrum analyzer continuously computes Fourier transforms of the input signal, separating the signal into its spectral components. Independent trigger levels can be applied to each spectral component. The result is a frequency domain mask.
A trigger is generated whenever any of the spectral components cross the mask. In this example, the mask excludes the larger signal. A trigger and subsequent signal capture is initiated on each and every occurrence of the smaller interferer. Once the trigger conditions are detected, then the real-time spectrum analyzer can capture a time record of the signal into memory. DSP software is then used to analyze the captured signals.
Time Limitations in Frequency Mask Trigger
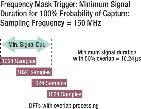
Digital Fourier Transforms (FFT, Chirp-Z) are computed over finite time records. A transient event must encompass the complete time record used to compute a transform in order for its frequency components to be accurately computed. This places the requirement of minimum signal duration for 100 percent capture using frequency mask trigger.
Figure 10 illustrates the minimum signal duration for 1024 sample DFTs. The minimum signal duration is three halves the DFT length for the case of 50 percent overlap, decreasing to a minimum of a single FFT length if more overlap is used. The key parameter is the minimum event duration that can accurately generate a trigger, which, along with analysis bandwidth and dynamic range, determine the analyzers ability to catch elusive transient events. The real-time spectrum analyzer shown previously uses overlap processing to perform a digital Fourier transform every 10.24 μS. It then compares its results with a user-defined mask, generating a trigger.
A single transient event with frequency content that crosses the mask and lasts longer than 10.24 μS has a 100 percent probability of generating a trigger. Once triggered, the selected time segment is captured into memory. The full capability of the analyzer’s digital signal processor can then be applied to the stored time record.
Comparisons

Table 1 shows the expected bandwidth, the steady-state dynamic ranges, the single event dynamic ranges for discovery and triggering along with the minimum signal duration for 100 percent probability of detection. Oscilloscopes are the instruments of choice when extreme bandwidth and high timing accuracy are needed. Oscilloscopes offer the best bandwidth and are capable of detecting signals of extremely short duration. Although modern oscilloscopes have the ability to perform Fourier transforms on the incoming signals, their dynamic range is limited to approximately 45 dB.
Swept spectrum analyzers offer the highest dynamic range in narrow spans and are the instrument of choice for measuring RF signals that do not change quickly over time. Swept spectrum analyzers are capable of steady-state dynamic ranges in excess of 80 dB. The swept analyzer’s ability to discover unknown transient signals is limited because a sweep cannot see all frequencies in a span simultaneously, requiring a signal to remain present for an entire sweep for a spectrum to be displayed accurately.
Vector signal analyzers are capable of steady-state dynamic ranges in the order of 80 dB and of analysis bandwidths of over 100 MHz. The VSAs available at the time of this publication are limited in their ability to discover short transients by their reliance on post-processing of stored data for performing Fourier transforms or other analysis. The minimum time for 100 percent probability of discovery is of the order of 5 to 10 ms.
Level triggers can detect events of the order of 10 ms, but only with very limited dynamic range. The real-time DSP engine at the heart of a real-time spectrum analyzer makes it possible to perform digital Fourier transforms with minimal or no gaps. This allows for the discovery of single RF events as short as 24 ms and for triggering on events as short as 10 ms with high single event dynamic range.
Conclusion
Modern RF communications systems are increasingly utilizing digital modulation transmitted in RF bursts lasting mere microseconds. Analysis and testing of these systems requires the ability to discover and capture RF events with increasingly short durations that happen in the presence of many other signals. Traditional definitions of bandwidth and dynamic range that require signals to be present for long periods of time may no longer be enough. One must look beyond the steady state and examine the ability of instrumentation to catch single RF events with high dynamic range and bandwidth, and ever decreasing durations.
