
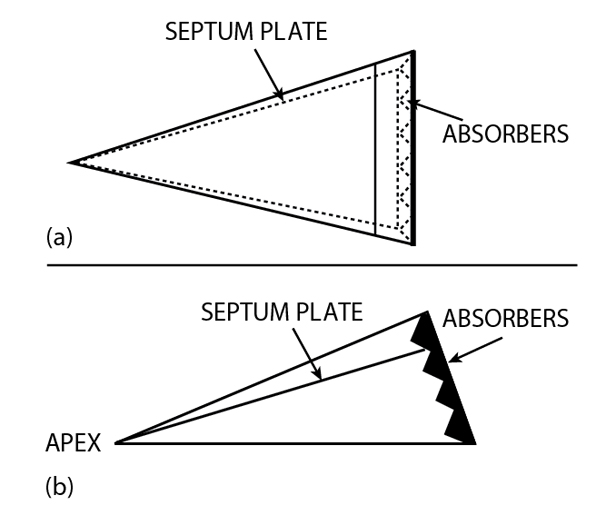
The gigahertz transverse electromagnetic mode (GTEM) cell was first proposed in 19871 and subsequently patented in 1989 by D. Konigstein and D. Hansen2 as a high frequency variant of the transverse electromagnetic mode (TEM) cell, which is also known as the Crawford cell.3 The GTEM cell consists of a tapered section of rectangular 50  transmission line loaded with an offset septum plate for increased working space to accommodate a larger equipment under test (EUT). The septum is offset and tapered in such a way that a 50 impedance is maintained along the length of the GTEM cell. Its termination is obtained by means of resistive 50 elements between the septum and the cell wall at low frequencies and by means of RF absorbers across the cell end wall at higher frequencies. The input of the GTEM cell starts with a 50 type N coaxial connector and is gradually transformed to the tapered rectangular transmission line through a precision crafted apex. The cross-sectional views of a GTEM cell are shown in Figure 1 .
The matched termination and the tapered structure of the GTEM cell contribute to a broader frequency performance from DC to a few gigahertz and larger working volumes, as compared to traditional TEM cells. Due to the enclosed metallic structure, GTEM cells provide a shielded environment without introducing the multiple reflections suffered with conventional shielded enclosures, giving better repeatability and accuracy of measurement results in a time efficient and cost-effective way. In 1995, the FCC officially accepted the use of GTEM cells as alternate test sites for equipment authorization purposes under Part 15 of the FCC rules.4 Measurements carried out in GTEM cells for radiated emission and susceptibility are well accepted by the international EMC/EMI standards organizations.
In addition to radiated emission and susceptibility tests, the GTEM cells can be used to measure the radiated sensitivity of receivers and small antenna gains and patterns5,6 as a less expensive alternative to anechoic rooms. Therefore, it is desirable and practical to measure antennas, radiated sensitivity, radiated emission and radiated susceptibility using one GTEM cell during the design process. Following up the review of basic formulas for the GTEM cells, the characterization of the reflection properties of a GTEM cell is presented. The measurement of radiated sensitivity for pagers and mobile phones using a GTEM cell is illustrated along with applications to self-jamming tests. Two balanced dipole antennas in both the cellular band and the PCS band have been measured using a GTEM cell and the results are compared with those obtained using an anechoic room.
Similar to the conventional radiated susceptibility tests, the effectiveness and limitations of antenna measurements using a GTEM cell are principally determined by the departure of the internal field structure from a plane-wave (TEM mode) field and the generation of the higher order waveguide modes. Based on measured results of spatial field distributions, Garbe and Hansen7 proposed the one-third rule that states that the EUT height and width should not exceed one third of the septum height and cell width, respectively. Crawford also proposed the one-third rule for the TEM cells.3 A rigorous analysis on the GTEM cell, dipole excitation and scattering by spherical objects inside the GTEM cells have been developed using the coupling theory of local modes.8,9 The dispersion and spatial power distribution of the fundamental and higher order modes in the GTEM cell were presented by R.D. Leo, et al.8 It would be beneficial to re-examine the one-third rule by this rigorous mode matching theory over a wider frequency range, beyond 1 GHz, for example, in order to establish the measurement error bounds using the GTEM cell.
Another source of errors is the absorption of higher order modes by the end RF absorbers. Hansen and Ristau10 have concluded that one of the main sources of problems in the GTEM cell is "broadband" termination.10 Further research work is needed to find out to what degree the RF termination affects the measurement errors.
Basic Formulas
Induced Electrical Field Strength
Since the electromagnetic wave propagates in the TEM mode inside the GTEM cell, the electrical field strength is given by
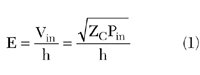
where
Vin = input voltage
Pin = input power into the GTEM cell
ZC = characteristic impedance of the GTEM cell
h = height between the septum plate and the horizontal bottom ground plane at the point of measurement
For a ZC = 50 cell at h = 1m, the electrical field strength can be expressed in decibels as
E(dBV/m) = -13 + 10logP in (dBm) (2)
To generate the electrical field strength of 6 V/m specified by the immunity test standard IEC61000-4-3 at h = 1m, from Equation 2, the required input power into the GTEM is 28.6 dBm or 720 mW. If the EUT is put where h  1m, a correction factor -20logh should be added to Equation 2.
Antenna Factor
The antenna factor (AF) is defined as the ratio of the incident electromagnetic field to the output voltage from the antenna, when terminated in a 50 load, as
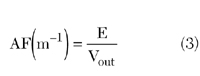
Substituting Equation 1 into Equation 3 yields
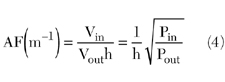
If an antenna under test (AUT) is placed inside the GTEM cell where h = 1m, the antenna factor of the AUT can be determined using
AF(m-1) = 20logV in - 20logV out =10logP in -10logP out (5)
Path Loss
The effective aperture of an antenna can be expressed in terms of gain and wavelength as

Since the dominant mode for GTEM cell is TEM, by invoking Equations 1 and 6, the output power of the antenna is

For a 50 cell and h = 1m,
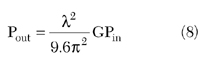
and the path loss of the GTEM from the input apex to the measurement point is
From Equations 4 and 8, the classical receiving antenna factor can be obtained as
AF(dBm -1) = 19.8 - 20log (m) - 10 logG (10)
Equation 8 also suggests a way to measure antenna gains using a GTEM cell as
G(dBi) = 19.8 - 20log (m) + 10logP out - 10logP in (11)
Characterization of the GTEM Cell
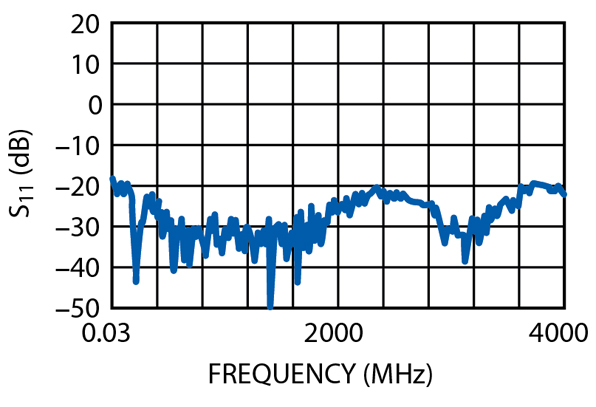
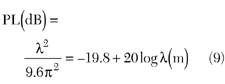
To characterize the reflection properties of the GTEM cell (ETS-5411), the return loss of the empty GTEM cell is measured over a frequency range from 30 MHz to 4 GHz, as shown in Figure 2 . It can be seen that the return loss is well below -20 dB over the frequency spectrum. To characterize the local characteristic impedance over the length of the GTEM cell, the step pulse responses of the GTEM cell are measured using time-domain reflectometry (Service Option 001 of HP 8753ES Vector Network Analyzer), as shown in Figure 3 . Around the measurement point (h = 1 m), marked by the cursor, which is about 4 m away from the apex, the local impedance is 64.2 . The deviation of the local impedance above 50 makes the apparent path loss larger and the measured antenna gain smaller. To correct for this impedance deviation, the height of the septum should be increased slightly.
Measurements of Radiated Sensitivity
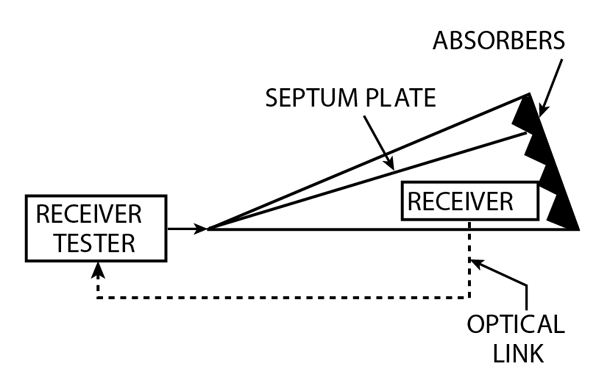
The block diagram for measurements of the radiated sensitivity of receivers, such as pagers, is shown in Figure 4 . In order to reduce the perturbation to electromagnetic fields caused by cables inside the GTEM cell, it is desirable to use a fiber-optic link between the receivers and the receiver tester. The input power of the receiver tester is stepped down from an adequate high power level until the threshold of a fixed bit error rate is achieved. The radiated sensitivity of the receiver in terms of electrical field strength can be easily calculated using Equation 2. It is useful to obtain directional radiated sensitivity by rotating the receiver inside the GTEM cell.
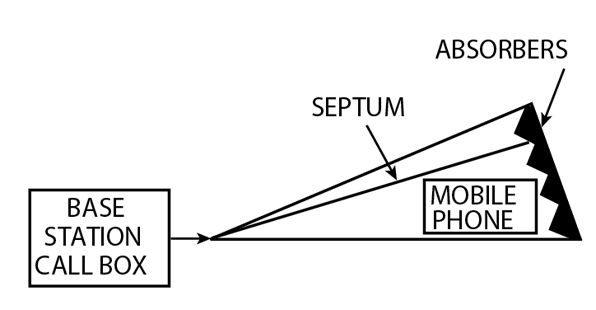
Figure 5 shows the block diagram to measure the radiated sensitivity of tranceivers, such as mobile phones, using a GTEM cell. An Agilent 8960 base station (BS) call box was used to measure the frame error rate (FER). Radiated sensitivity of the receiver of a mobile station (MS) is defined as the minimum received power at which the FER does not exceed a specified value, usually  0.5 percent. The data loop back service is used for the fundamental channel test. The BS sends pseudorandom data to the MS. The MS demodulates the BS data and transmits it back to the BS. The BS compares the sent and received data and determines how many errors occurred in the MS's reception of the data. It is assumed there are no transmission errors from the MS back to the BS.
The test data service option (TDSO) can be used for testing data supplement channels (SCH). The BS sends a known data pattern. The MS compares the received and expected data and determines how many errors occurred in the received data. It then sends the error result back to the BS via a reverse signaling channel.
In both test methods of data loop back service options and the TDSO, it is necessary to know the path losses experienced by the forward and reverse signals inside a GTEM cell to calculate the radiated sensitivity. In Tables 1 and 2 , the path losses from the input apex point to the test point where h = 1 m inside the GTEM cell for both cellular and PCS bands are listed. It is also desirable to measure the angular distribution of the radiated sensitivity by rotating the MS inside the GTEM cell.
|
Table 1 | ||||||
|
|
Tx |
Rx | ||||
|
Channel number |
1013 |
384 |
777 |
1013 |
384 |
777 |
|
Frequency (MHz) |
824.70 |
836.52 |
848.31 |
869.70 |
881.52 |
893.31 |
|
Path loss (dB) |
28.6 |
28.7 |
28.8 |
29.0 |
29.1 |
29.3 |
|
Table 2 | ||||||
|
|
Tx |
Rx | ||||
|
Channel number |
25 |
600 |
1175 |
25 |
600 |
1175 |
|
Frequency (MHz) |
1851.25 |
1880.00 |
1908.75 |
1931.25 |
1960.00 |
1988.75 |
|
Path loss (dB) |
35.6 |
35.7 |
35.8 |
36.0 |
36.1 |
36.2 |
There are two quantities used to describe the radiated sensitivity, that is, the effective isotropic sensitivity (EIS) and the total isotropic sensitivity (TIS), according to the Cellular Telecommunications and Internet Association (CTIA).11 In the ideal case where the antenna is lossless (100 percent efficiency) and there is no radiated self-jamming, the TIS is equal to the conducted sensitivity under the mobile environment where the incident field has uniform angle distribution.12 In actuality, antenna efficiency and interferences from RF transmitters, baseband circuits and LCD displays will impair the radiated sensitivity. The EIS can be expressed as
EIS( ,
, ) = P S - G( , ) + L S (12)
where
PS = conducted sensitivity
G( , ) = receiver antenna gain, which is directional
LS is the lumped self-jamming term accounting for interferences caused by RF transmitters, baseband circuits and LCD displays.
It is noted that the EIS could be better than the conducted sensitivity if the antenna gain is above 0 dB and there is no self-jamming degradation.
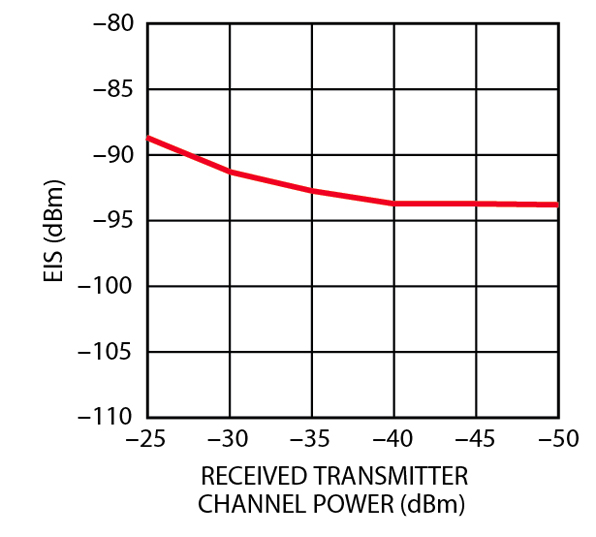
In practical designs, it is usually a challenging task to isolate and suppress the sources of interference from different board modules. Generally speaking, the interferences can be categorized as transmitter power dependent, baseband circuit dependent and display dependent. Figure 6 shows the EIS of a prototype mobile phone as a function of transmitter power. Since the measured EIS was improved by 5 dB after the transmitter power was set back by 15 dB from the maximum transmitter power allowed by the mobile phone, it was concluded that the transmitter jammed the receiver. As the EIS approached a value around -94 dBm, which was higher than the conducted sensitivity -108 dBm, it was further concluded that there exists other interferences caused by baseband circuits and the LCD display.
Antenna Gain Pattern Measurements
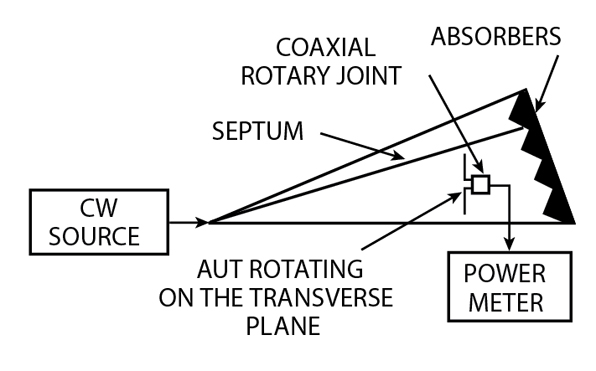
Antenna gains and patterns were measured using a GTEM cell for two balanced dipole antennas at 824 MHz (cellular band) and 1.85 GHz (PCS band). The return losses of the GTEM cell are -30 dB at 824 MHz and -27 dB at 1.85 GHz. The input power to the AUT was first measured and the output power at the GTEM apex was subsequently measured for different dipole rotation angles with respect to the vertical, as shown in Figure 7 . A coaxial rotary joint was used to facilitate the rotation of the AUT and to minimize the movement of the feeding cable. The antenna gain can be determined from Equation 11 and the relevant path loss values from the tables. It is noted that the dipole antennas should be rotated in the cross-sectional plane of the GTEM, instead of in the horizontal plane as suggested by C. Icheln.6 When the arms of the dipole antenna are in the vertical position, the electric fields of the GTEM cell and the dipole antenna are aligned, resulting in the maximum output power at the apex. This is the position where the antenna gain can be calibrated by a GTEM cell.13,14

The antenna gain patterns obtained using the GTEM cell and the anechoic room are shown in Figure 8 for 824 MHz and in Figure 9 for 1.85 GHz. It is observed that, at a frequency of 824 MHz, the ratio of the antenna gain maximum to the minimum is about 15 dB using the GTEM cell and about 25 dB using the anechoic room. This can be attributed to the relatively large size of the cellular band dipole antenna (about 16 cm long) as compared to the uniform field volume of the GTEM cell. At the PCS band frequency of 1.85 GHz, the ratio of the antenna gain maximum to the minimum obtained using the GTEM cell is about -25 dB, even 7 dB deeper than one measured in the anechoic room. The antenna main lobes measured using both the GTEM cell and the anechoic room agree well in the PCS band; in the cellular band, the GTEM cell gives broader antenna main lobe than the anechoic room.

There are three major uncertainties in antenna pattern measurements using a GTEM cell - reflection from the matching termination, higher order GTEM waveguide modes and the leakage current on the feeding cable. A well-tuned GTEM cell should be able to give around -25 dB return loss across the spectrum. For the GTEM cell used, the return loss could be further improved if the local characteristic impedance is fine tuned to 50 . In the measurements, the AUT is positioned about 1 m away from the tips of the absorption materials and the return loss from the matching termination would be expected to be worse than -25 dB due to the near-field effects. Nevertheless, since the AUT was rotated in the cross session of the GTEM cell, the reflection from the matching termination should remain at the same level for all angles.
The higher order waveguide modes excited by the AUT can propagate towards the matching section, and will be cut off towards the input port of the GTEM cell.9 Due to its tapering structure, the GTEM cell behaves as a low pass filter. The higher order waveguide modes are responsible for the nonuniform fields in the test volume of the GTEM cell. As pointed out by R.D. Leo, et al.,9 the higher order waveguide modes propagating towards the apex have smaller amplitudes than the ones propagating towards the matching section, and convert to the fundamental TEM mode nicely and completely. The higher order waveguide modes traveling towards the matching section will not be absorbed as well as the TEM mode and thus are reflected towards the apex of the GTEM cell, limiting the dynamic range of the measurements. The reflection of electromagnetic waves from the "broadband" RF absorbers is one of the main error sources in measurements.10
The leakage current along the feeding cables gives problems to antenna measurements in both the GTEM cell and the anechoic room. The practical and effective solutions to reduce the leakage current are ferrite beads, baluns and reducing cable movements.
Conclusion
It is practical and economical to use GTEM cells to measure small antenna gain patterns as well as to perform radiated sensitivity measurements, radiated emission tests and radiated susceptibility tests. A 6 m long GTEM cell seems to be sufficient for mobile phone applications. The main source of measurement uncertainties is the reflection from the matching section for the TEM and the higher order waveguide modes.
Acknowledgment
The author would like to thank Randy Chang, Mark Zube and Shaun Trussler for their help in using the Agilent 8960 call box, Jari Van-Wonterghe for antenna measurements using the anechoic room, Steve Walmsley for the use of the GTEM cell and Eric Guetre for support.
References
1. D. Koenigstein and D. Hansen, "A New Family of TEM Cells with Enlarged Bandwidth and Optimized Working Volume," Proceedings of the 7th International Zurich Symposium and Technical Exhibition on EMC , March 1987, pp. 127-132.
2. D. Hansen and D. Koenigstein, "Patent CH 670 174 A5: Vorrichtung Zur EMI-Prufung Electronisher Gerai, 1989.
3. M.L. Crawford, "The Generation of Standard EM Fields Using TEM Transmission Cells," IEEE Transactions on Electromagnetic Compatibility , Vol. 16, No. 11, November 1974, pp. 189-195.
4. FCC Public Notice 54792, "FCC Expands Use of GTE Cells for Equipment Authorization Measurements," July 1995.
5. C. Icheln, P. Vainikainen and P. Haapala, "Application of a GTEM Cell to Small Antenna Measurements," Proceedings of 1997 IEEE AP-S International Symposium and URSI North American Radio Science Meeting , Montreal, Canada, July 1997, pp. 546-549.
6. C. Icheln, "Method for Measuring RF Radiation Properties of Small Antennas," PhD dissertation, Helsinki University of Technology, Espoo, Finland, October 2001.
7. H. Garbe and D. Hansen, "The GTEM Cell Concept: Applications of This New EMC Test Environment to Radiated Emission and Susceptibility Measurements," Proceedings of the 7th International Conference on Electromagnetic Compatibility , York, UK, 28-31 August 1990, pp. 152-156.
8. R.D. Leo, T. Rozzi, C. Svara and L. Zappelli, "Rigorous Analysis of the GTEM Cell," IEEE Transactions on Microwave Theory and Techniques , Vol. MTT-39, No. 3, March 1991, pp. 488-500.
9. R.D. Leo, L. Pierantoni, T. Rozzi and L. Zappelli, "Dipole Excitation and Scattering by Spherical Objects in a GTEM Cell," IEEE Transactions on Microwave Theory and Techniques , Vol. MTT-42, No. 9, September 1994, pp. 1700-1708.
10. D. Hansen and D. Ristau, "Sources of Problems in the GTEM Field Structure and Recommended Solutions," IEEE International Symposium on Electromagnetic Compatibility , Santa Clara, CA 1996, pp. 48-51.
11. Cellular Telecommunications & Internet Association, "Method of Measurement for Radiated RF Power and Receiver Performance," Rev. 2.0 draft, August 2002.
12. W.C. Jakes, Editor, Microwave Mobile Communications , John Wiley & Sons Inc., New York, NY 1974, Chapter 3.
13. E.L. Bronaugh and J.D.M. Osburn, "Measuring Antenna Parameters in a GHz Transverse Electromagnetic (GTEM) Cell," IEEE International Symposium on Electromagnetic Compatibility , Anaheim, CA 1992, pp. 229-231.
14. T. Hong, C.L. Chou and A. Kuo, "Improving Calibration of Broadband Antenna Factors in a GTEM Cell," IEEE International Symposium on Electromagnetic Compatibility , Tokyo, Japan 1999, pp. 592-595.
Ping Hui received his BSEE degree from Changsha Institute of Technology, Hunan, China, in 1982, his MSEE degree from Zhejiang University, Zhejiang, China, in 1985, and his PhD degree in electrical engineering from Polytechnic University, New York, in 1991. He currently works for Nokia Mobile Phones, Vancouver, BC, Canada, as an antenna specialist. He was previously an associate professor with the school of electrical and electronic engineering at Nanyang Technological University, Singapore. He has completed many industry consultancy projects related to airport radar reflections from buildings and microwave motion sensors. He can be reached via e-mail at ping.hui@ieee.org.