
The prime requirements of a handheld spectrum analyzer are for it to be lightweight, compact, but with as large a display as possible, and exhibit low power consumption - all within a sturdy housing. These criteria are not easy to fulfill in themselves, so it is an even greater task to offer RF characteristics that are similar to those of desktop units. However, through large-scale integration and low power consumption of application-specific integrated circuits (ASIC), the FSH3 spectrum analyzer meets these requirements. In fact, the instrument uses six different ASICs to provide the functions of a top-class spectrum analyzer with an integrated tracking generator.
The FSH3 handheld spectrum analyzer is available in two versions, either as a pure 100 kHz to 3 GHz spectrum analyzer or as a spectrum analyzer with a tracking generator for scalar network analysis. Equipped with other options such as a power sensor and a VSWR bridge, it can be used as a power meter, a scalar network analyzer or an analyzer for distance-to-fault measurements on cables.
Sophisticated Technology
At the heart of the instrument is an ASIC processor with a 32-bit RISC processor, a display controller and elements for controlling the periphery such as the RS-232 interface or the power sensor. The processor is used for operating the instrument, controlling the measurement sequences, and calculating and displaying the results. Management of the power supply and the nickel metal hydride battery is handled by a separate ASIC.
The RF receive path (shown in Figure 1  ) is designed as a threefold converting superheterodyne receiver with a high first intermediate frequency. With damage prevention being a key consideration in such instruments, the RF input is particularly well protected by a combination of overvoltage arrester, PIN diodes and capacitive coupling so that the attenuator or the input mixer will not be damaged if high voltage is inadvertently applied or if electrostatic discharge occurs.
The instrument's mode of operation is such that the first local oscillator with a high frequency range of 4031.25 to 7031.25 MHz converts the input frequency to the first intermediate frequency (4031.25 MHz) and consists of three voltage-controlled oscillators (VCO), each covering a frequency range of 1 GHz. Two components specially developed for synthesizers - a high frequency predivider and a divider for fractional division ratios with integrated phase detector - generate a sweep that is synchronized to the 10 MHz temperature-compensated crystal oscillator (TCXO) at each frequency point. The FSH3 spectrum analyzer therefore represents receive signals at the correct frequency even with large display ranges of the order of 3 GHz.
Signal processing starting at the last intermediate frequency is purely digital. An A/D converter digitizes the 31.25 MHz IF signal and two integrated circuits perform all other processing steps such as IF filtering, envelope detection, logarithmation, video filtering and signal detection in real time. The main processor retrieves and displays the configured data.
Using this concept the spectrum analyzer offers the functions and characteristics provided by desktop units but implements them on the small footprint of a handheld unit. For instance, it offers resolution bandwidths from 1 kHz to 1 MHz in 1-3-10 sequence. These bandwidths are designed for optimum settling in the frequency sweep with Gaussian filter characteristics. The common method of using a four-pole analog filter with decoupled contacts also yields a virtually Gaussian filter characteristic in the passband but at the expense of selectivity. Here, the shape factor of the 60 dB bandwidth to the 3 dB bandwidth would typically be < 15. However, much higher selectivity can be obtained with digital implementation, so with the FSH3 instrument the shape factor of the 60 dB bandwidth to the 3 dB bandwidth is < 6. This makes it much easier to separate adjacent signals, especially if they differ greatly in amplitude.
Another feature is the practically error-free rectification and logarithmation of the filtered IF signal, whereby the IF signal envelope is determined mathematically. After envelope detection, the signal is logarithmized for logarithmic representation. Since the two operations are performed by calculation in the digital circuits they are practically error-free and the deviation of the display linearity from the ideal value depends almost exclusively on the linearity of the A/D converter.
Video bandwidths of 10 Hz to 1 MHz are also in 1-3-10 sequence. The attenuation characteristic of the video low pass filters is similar to that of RC low pass filters. This ensures that the smoothing of the trace is similar to that of analyzers with analog RC low pass filters when the video bandwidth is reduced.
The handheld spectrum analyzer also utilizes different detectors for signal weighting, namely auto-peak, peak, sample and the RMS detector that is applied to the power measurement of modulated signals. Since the detectors are digital, there are distinct advantages. The peak detector, for example, is free from effects often experienced by analog versions, such as charge time, discharging and storage effects.
There is also the advantage that an RMS detector can be implemented, which means that the power of signals can be measured without regard to the detector characteristic in the same way that a thermal power meter does. An RMS detector is particularly important in measuring the power of modulated signals such as W-CDMA signals, an example of which is shown in Figure 2 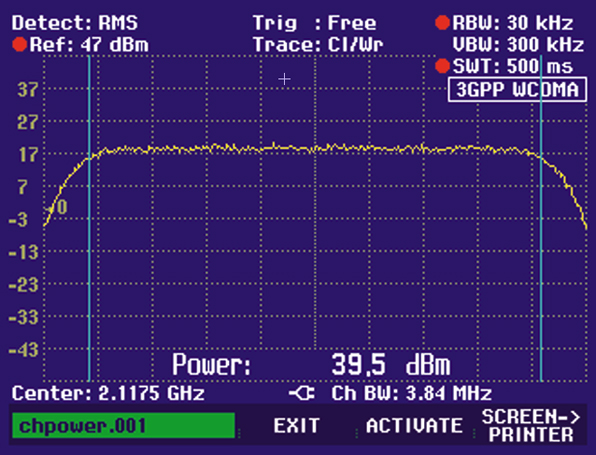 . With the channel power function the instrument measures the power accurately and reproducibly in a single sweep.
Due to the digital design concept the functions referred to are highly constant and reproducible. For example, the error caused by a bandwidth switchover is negligible. The display linearity depends entirely on the linearity of the A/D converter whose linearity error is also negligible in practice. The level measurement uncertainty is almost exclusively a factor of the absolute gain of the IF section and of the frequency response of the attenuator and the input mixer, with the FSH3 correcting the two parameters during measurement. The frequency response is stored in the instrument for all RF attenuator settings and during measurement the displayed level is corrected at each frequency. The instrument also monitors its internal temperature and corrects the total gain accordingly, with the result being a specified total level measurement uncertainty of 1.5 dB max.
Despite low power consumption and associated limited processor power, the digital design concept produces a relatively high measurement speed, due to the ASICs processing the IF data in real time. The minimum sweep time is only 100 ms if the entire frequency domain is displayed, while with time domain measurement (span = 0 Hz), the minimum sweep time is just 1 ms. The power available (7 W with tracking generator for an operating time of 3.5 hours with one battery charge) can thus be used more effectively for the RF dynamic range of the RF front-end. With a typical third-order intercept of 15 dB, at a noise figure of 32 dB (typical), the spectrum analyzer attains values comparable to those obtained with high end desktop analyzers.
Easy Operation
Because the spectrum analyzer is used for field maintenance and service, it must be easy to operate when working under difficult conditions as well as when accessing functions and reading results. There is direct access to all basic functions at a keystroke without soft key control and the keys are arranged so that if holding the instrument with both hands all keys and the roll key can easily be reached with the thumbs. The analyzer has only one submenu level, and markers and delta markers come in handy when processing results on the 14 cm color LC display. Up to 100 measurements, including all settings, can be stored in the internal memory at the press of a button.
The instrument comes with a Windows™ software that takes the results of measurement from the analyzer and stores them in common graphics formats (Bitmap, Windows Metafile, PNG, PCX) as text files or in Excel™ format. The date and time of the measurements and all settings are provided to ensure transparent documentation, and additional comments can be added and stored in the software. Since a Word macro is available to generate a customer-specific report, the user can easily integrate the results into pre-defined forms.
Conclusion
The FSH3 handheld spectrum analyzer combines lightweight portability with sophisticated functionality and performance. It is user-friendly and easy to operate yet offers characteristics comparable with high end desktop analyzers.
Rohde & Schwarz GmbH & Co. KG, Munich, Germany + 49 89 4129 11765, www.rohde-schwarz.com. Circle No. 300