
Technical Feature
System-level Filter Design Methodology for WLAN-OFDM Transceivers
Orthogonal frequency division multiplex (OFDM)-based WLAN standards target wireless communications in the 5 GHz band for consumer multimedia applications. Digital OFDM transceiver ICs, based on frequency domain equalization, have been presented. However, it is still a challenge to design a complete system, including the front-end, with minimum degradation of the performance offered by the digital modem. This article focuses on mixed-signal filtering aspects, introducing filters in the system signal path that reduce or even completely corrupt the system performance, even if the filters fulfill the spectral specifications. Therefore, an efficient model was developed, which provides direct insight to the cause of degradation due to filtering, and additional specifications (apart from the filter mask) are defined. Given these specifications, a system-level filter design methodology to efficiently constrain the implementation loss and implementation complexity is presented and illustrated in a design case.
B. Debaillie, B. Come, W. Eberle and S. Donnay
IMEC v.z.w., DESICS
Leuven, Belgium
H. Minami
Sony Co.
Kanagawa, Japan
WLAN standards, based on OFDM transmission, allow local networks to go wireless while offering multimedia communications. Digital OFDM transceiver ICs for wireless communication in the 5 GHz band have been presented.1 It is a challenge for the design teams to build a complete system, including the OFDM front-end, with minimum degradation of the overall performance offered by the digital modem. As these modems equalize in the frequency domain only, strong performance degradation will potentially occur when mixed-signal filters are introduced in the signal path. This is exemplified in Figure 1 , showing the bit error rate (BER) performance when two different channel-select filters meeting the same filter mask are inserted in the zero-IF WLAN-OFDM receiver front-end. This simulation does not include adjacent channels, so co-channel interference and blockers are not present. Although the filters are designed not to affect the in-band signal frequencies, some cause important BER degradation. The zero-IF WLAN-OFDM receiver front-end is shown in Figure 2 .
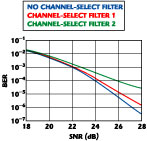
Fig. 1 BER degradation caused by channel filter insertion in the receiver front-end signal path.

Fig. 2 The receiver front-end signal path.
Unfortunately, analyzing the filter impact based on BER calculations requires time-consuming simulations. Moreover, these BER results do not provide a direct insight to the cause of performance degradation. In this article, the cause of degradation is explained and a model is presented allowing direct insight in this source of degradation. The model allows analyzing given filters as additional filter specifications are defined. Instead of analyzing given filters, an efficient system-level filter design methodology is presented to define the filter parameters according to cost constraints while having insight into the influence of parameter fluctuations. This methodology is illustrated in a practical filter design example.
Filtering WLAN-OFDM Signals
In baseband WLAN-OFDM modems, both intersymbol interference (ISI) and intercarrier interference (ICI) are prevented by insertion of cyclic prefixes (CP) between successive symbols, with a minimal length equal to the duration of the channel-impulse response.2 As the duration of the WLAN channel-impulse responses are relatively short, the length of CP is standardized to 16 samples at 20 MHz, both in IEEE 802.11a and ETSI HIPERLAN/2. However, in complete systems, both the channel and filters in the signal path will contribute to an overall impulse response. As the duration of this response is longer than the channel response alone, it will potentially exceed the length of CP. If this is the case, successive symbols are no longer sufficiently guarded so that ISI will occur. As WLAN modems apply frequency domain equalization, ISI consequently leads to ICI because the orthogonality between subcarriers will no longer be preserved.

Fig. 3 BER vs. receiver synchronization location, generated by the system simulation model.
ISI/ICI Versus Synchronization
Both the duration and shape of the overall impulse response determine the amount of ISI and ICI. Yet, with a given response, the amount of interference is also dependent on the synchronization location at the receiver. This is described in references,3,4,5 where the optimal synchronization location is determined in order to minimize ISI and ICI. However, reference3 does not take the overall response into account, whereas references4,5 require time-consuming simulations.
A MATLAB system simulation tool6 was used to investigate the BER degradation due to filters in the signal path. As this tool performs BER computations based on Monte-Carlo simulations, it requires time-consuming computations. Having direct access to the ISI and ICI degradation would give real insight to the filter impact.

Fig. 4 SIR (ISI/ICI) vs. receiver synchronization location, generated by the ISI/ICI-Sync model.
This motivated the design of a new model (ISI/ICI-Sync model) that directly calculates the signal to ISI and ICI interference ratio (SIR) versus the synchronization location for any given set of mixed-signal filters and dispersive channel. Figure 3 shows the BER system performance with respect to the synchronization location. It is obtained from time-consuming (five hours) system simulations as described in reference,6 while changing the synchronization location at the receiver. The only filter applied in this system is a band-select filter. The BER is minimum and relatively stable (BER ≈ 6.10-6 ) between synchronization location 11 and 25, whereas the performance degrades severely outside this range. In comparison, Figure 4 shows the amount of SIR due to the same band-select filter, in relation to the synchronization location. This curve is obtained by applying the efficient (six second computation time) ISI/ICI-Sync model. It shows that the SIR curve has a triangular shape with a maximum at synchronization location sample 18. Comparing the two graphs, it is expected that an increased interference (lower SIR) results in a degraded system performance (higher BER). This is only valid for systems synchronizing outside the synchronization range. However, within this range changes in the SIR will not result in changes of the BER because the amount of ISI/ICI becomes negligible (SIR > 35 dB) compared to the noise sources in the system (in this case quantization and thermal noise). Therefore, the BER system performance within the synchronization range is constant and optimal from an ISI/ICI point of view. For BER degradation caused by ISI/ICI, the impact of the filter can be investigated more efficiently using the SIR curve.

Fig. 5 Block diagram of the ISI/ICI-Sync model.
ISI/ICI-Sync Model
The block diagram of the ISI/ICI-Sync model is shown in Figure 5 , where an OFDM sequence s(n) feeds two calculation paths. Both calculation paths convolve the OFDM sequence with the overall filter- and channel-impulse response h(n) while taking the synchronization location syncLoc into account. The convolution shown on the left potentially results in an ISI/ICI affected signal l(n) whereas the convolution shown on the right results in an ISI/ICI free signal r(n). These two results are compared after demodulation and equalization to obtain the signal to ISI/ICI interference (SIR) with respect to the synchronization location. A possible result of this ISI/ICI-Sync model was shown previously.

Fig. 6 Illustration of the ISI/ICI affected convolution and synchronization algorithm used in the ISI/ICI-Sync model.
ISI/ICI Affected Convolution
The incoming OFDM sequence s(n) with length Lp , consisting of Ns symbols with a length of Ls , is shown in Figure 6 . This sequence is extended with guard intervals of length Lg by pre-pending every symbol with a copy of its tail as in (b). This extended sequence is called l1 (n). Within the convolution result of l1 (n) and the overall impulse response h(n) with length Lh , l2 (n) is selected based on syncLoc as shown in (c) and (d). Mathematically, l2 (n) is expressed based on l1 (n) as

while
l1 [k] = 0 if k ≤ 0 and k > Lpg
Finally, after removing the guard intervals between the successive symbols of sequence l2 (n), the output of the convolution l(n) with a length Lp is obtained as shown in (e).

Fig. 7 Illustration of the ISI/ICI free convolution and synchronization algorithm used in the ISI/ICI-Sync model.
ISI/ICI Free Convolution
The incoming OFDM sequence s(n) with length Lp , consisting of Ns symbols with a length of Ls , is shown in Figure 7 . This sequence is split in its individual symbols r1 (n) as in (b). Convolution of the individual symbols r1 (n) and the overall impulse response h(n) with length Lh results in symbols longer than Ls , as shown in (c). The signal within the increased length can be isolated and circularly added to the truncated part, resulting in r2 (n) as in (d). Mathematically, r2 (n) is expressed based on r1 (n) as

where

The resulting symbols r2 (n) are then synchronized by cyclic extension as shown in (f). Mathematically, this operation is expressed as
r3 [i] = r2 [modulus(i + syncLoc,Ls )] 1 ≤ i ≤ Ls (3)
The final ISI/ICI convolution result r(n) is obtained by combining the different symbols of r3 (n) to one sequence as shown in (g).
|
Table 1 | ||
|
|
Filter Mask | |
|
|
Frequency |
Attenuation |
|
In-band |
0 to 8.3 |
0 to 3 |
|
Out-of-band |
> 11.7 |
>28 |
|
|
Channel-Select Filter | |
|
|
1 |
2 |
|
|
Butterworth |
Chebyshev I |
|
Order |
11 |
7 |
|
-3 dB frequency (MHz) |
8.5 |
8.5 |
|
Pass-band ripple (dB) |
- |
1 |
Analyzing the Impact of Filters in the Signal Path
As an illustration, the impact of two channel-select filters in a zero-IF WLAN-OFDM receiver will be analyzed. The two filters, one Butterworth and one Chebyshev I type filter, are parameterized according to the given filter mask. The filter parameters are listed in Table 1 , whereas the transfer functions are shown in Figure 8 . Introducing these filters in the receiver architecture result in BER performances as previously shown. These simulations indicate serious performance degradation, mainly due to the introduction of the second filter.

Fig. 8 Transfer functions of two channel-select filters meeting a given filter mask specifications.
Instead of analyzing the filter impact based on BER simulations, it is more efficiently analyzed based on the SIR curves as these curves provide direct insight in the cause of degradation. These curves can be analyzed on three criteria:
- The width of the synchronization range. This represents the maximal tolerable synchronization jitter at the receiver, without affecting the BER system performance due to ISI/ICI.
- The curve-gradient outside the synchronization range. This indicates the BER degradation when synchronization drift pushes the receiver outside the synchronization range.
- The amount of SIR within the synchronization range. This represents the behavior of the synchronization range with respect to improved system SNR.
These criteria are now illustrated for the two channel-select filters represented in the table, introduced in the original receiver architecture. The SIR curve is calculated first as a reference when no channel-select filter is introduced. In this case, the only filter in the system is a band-select filter. Then, the channel-select filter 1 is added. Finally, the channel-select filter 2 replaces the first channel-select filter. The three SIR calculation results are shown in Figure 9 .

Fig. 9 Impact of channel-select filters on SIR.
The amount of ISI/ICI is first assumed to be negligible with respect to the system noise when SIR > 35 dB. Note that the term 'system noise' includes the noise sources in the system (that is, thermal noise and quantization noise) apart from ISI and ICI, relative to the signal power. Thus, the synchronization range at SIR = 35 dB for the different filter sets are obtained from the figure. The introduction of the first channel-select filter results in a shift of the synchronization range by six samples (300ns), whereas the width remains almost the same - 12 samples (600ns). Therefore, the maximum tolerable synchronization jitter is constant. Since the curve-gradient just outside the synchronization range is different for each side, the impact of synchronization drift depends on either side. As the SIR within the synchronization range is smaller compared to the reference, improved system noise will change the behavior of the synchronization range severely. The introduction of the second channel-select filter, however, indicates a strong BER degradation at all synchronization locations since no synchronization range can be observed for SIR = 35 dB.
Now assume the system noise is higher, so the ISI/ICI can be neglected when SIR > 25 dB. Again, the synchronization range at SIR = 25 dB for the different filter sets is obtained from the figure. The introduction of channel-select filter 1 results in the same behavior as previously described, except for the width of the synchronization range, which is increased to 15 samples (750 ns). The introduction of channel-select filter 2 will, in this case, have a synchronization range with limited impact on the BER system performance. The width of the synchronization range is equal to 10 samples (500 ns) and is shifted, compared to the reference case, by nine samples (450 ns). Again, the curve-gradient just outside the synchronization range differs strongly between sides.
Therefore, analyses of the given filters based on the SIR curves indicate a strong BER degradation at low system noise, when the channel-select filter 2 is introduced. Complete system simulations with a fixed synchronization location (sample 18) confirm this degradation. Based on these results, the BER degradation is quantified in terms of implementation loss (IL), as shown in Table 2 .
|
Table 2 | ||
|
|
Channel-Select Filter | |
|
1 |
2 | |
|
|
Butterworth |
Chebyshev I |
|
Implementation |
1 |
5 |
System-level Filter Design Methodology
Introducing filters in the signal path of a system can be evaluated according to cost criteria, such as impact on system performance, implementation complexity or bill of material. The proposed filter design methodology to design low cost filters at the system-level, shown in Figure 10 , is based on five elimination steps. These steps guide the system designer from a given set of specifications through filter-type selection and determination of the filter parameters. Then, the selected filters are compared based on cost functions, and implemented in a complete system simulation model in order to determine the overall system performance. This methodology is illustrated for the design of a LP channel-select filter in the zero-IF WLAN OFDM receiver architecture shown previously.
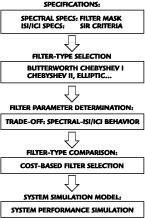
Fig. 10 Proposed system-level filter design methodology.
Step 1: Specifications
In the first step of the methodology, the system designer provides specifications on the spectrum and the ISI/ICI: The filter mask provides the spectral specification. For the design case, the filter mask in Table 3 is an extension of Table 1.
The required ISI/ICI specification is the selection of one or more SIR criteria described in the preceding section. For the design case, the first SIR criterion is selected: the width of the synchronization range, larger than five samples (20MHz sampling) at SIR = 35 dB. This SIR value is given as the design of a complete WLAN-OFDM system, based on 52 non-zero 64QAM-modulated subcarriers with a coding rate of 3/4, targets a SNRtotal (excl. channel) = 30 dB at the slicer so that the front-end impact is negligible even in perfect channel conditions.
|
Table 3 | ||
|
|
Frequency |
Attenuation |
|
In-band ripple |
0 to 8.3 |
0 to 3 |
|
Adjacent channel |
11.7 to 28.3 |
>28 |
|
Alternate adjacent channel |
31.7 to 48.3 |
>54 |
|
Out-of-band blocker |
>50 |
>59 |
Step 2: Filter-type Selection
The designer has to select one or more filter types. For the design case, common filter types are selected, including Butterworth, Chebyshev I, Chebyshev II and elliptic.
Step 3: Filter Parameter Determination
The filter parameters are determined based on a trade-off between the spectral behavior and the ISI/ICI behavior. For the design case, the parameterization of the Chebyshev I filter-type is detailed. This filter-type is characterized by three parameters - the filter order (n), the ripple in the pass-band (Rp) and the -3 dB frequency (Fc ). Based on these parameters, both the spectral behavior and the ISI/ICI behavior are calculated, as shown in Figure 11 .

Fig. 11 Trade-off curves for determination of the Chebshev I filter parameter; (a) ripple in the pass-band and (b) -3 dB frequency.
First, the acceptable Rp range according to the given specifications is determined. Given the filter mask specification (minimal attenuation at 11.7 MHz = 28 dB, toughest spectral spec), the graph shows that only n = 10 is acceptable when Rp ≥ 0.75 dB. A larger Rp results in higher attenuation. Given the ISI/ICI specifications (minimal synchronization range width = 5 samples at SIR = 35 dB), a filter order 10 is shown to be acceptable when Rp ≤ 2.25 dB. A smaller Rp results in a larger synchronization range. As a result, 0.75 dB ≤ Rp ≤ 2.25 dB is acceptable with filter order 10 and Fc equal to 10.5 MHz.
Then, the acceptable Fc range according to the given specifications is determined. Given the filter mask specification, a filter order 10 is acceptable when Fc ≤ 10.5 MHz, while a smaller Fc results in larger attenuation. Given the ISI/ICI specification, a filter order 10 is acceptable for Fc ≥ 10.25MHz, while a larger Fc results in a larger synchronization range. As a result, 10.25 MHz ≤ Fc ≤ 10.5 MHz is acceptable with filter order 10 and Rp equal to 1 dB.
Within the obtained parameter ranges, the spectral and ISI/ICI behavior are traded-off. Given that the ISI/ICI behavior is prior, low Rp and high Fc are required. Hence, the obtained Chebyshev I filter parameters are n = 10, Rp = 1 dB and Fc = 10.5 MHz, resulting in an 8.5 sample synchronization range width and a 29.3 dB attenuation. Likewise parameterization is performed for the other filter types, as shown in Table 4 .
|
Table 4 | ||||
|
|
Butterworth |
Chebyshev-I |
Chebyshev-II |
Elliptic |
|
Filter order |
13 |
10 |
8 |
7 |
|
-3 dB frequency; Fc (MHz) |
9.0 |
10.5 |
9.0 |
10.5 |
|
Ripple in the pass-band: Rp (dB) |
- |
1.0 |
- |
1.0 |
|
Rejection in the stop-band: Rs (dB) |
- |
- |
60 |
60 |
|
Attenuation at 11.7 MHz (dB) |
29.6 |
29.3 |
29.2 |
33.9 |
|
Attenuation at 31.7 MHz (dB) |
142.2 |
141.8 |
60.5 |
61.6 |
|
Attenuation at 50.0 MHz (dB) |
193.6 |
182.9 |
65.0 |
60.3 |
|
Sync range at SIR=35 dB (sample) |
10 |
9 |
12 |
11 |
Step 4: Filter-type Comparison and Selection
The characterized filters are then compared based on cost functions. These cost functions, that is, implementation complexity, in-band loss, tolerable synchronization jitter or bill of material, are design dependent. As this is not the focus of this article, a selection between different filter types will not be made but all filter types will be considered.
Step 5: System Simulation Model
Finally, all these parameterized filters are implemented in the complete system simulation model to determine the implementation loss and overall system performance. This system simulation model can then be used to investigate the effect of front-end non-idealities, dispersive channels, and the presence of adjacent channels and architectural alternatives. Here, the implementation loss is calculated for uncoded 64QAM modulation in an AWGN channel. The implementation losses of the selected filters are very small, as shown in Table 5 , meaning that the introduction of these filters will result in negligible performance degradation.
Comparison of the impact of filters parameterized based on spectral specifications only with filters parameterized based on the proposed methodology is remarkable. The examples show an improved implementation loss of 0.9 dB up to 4.9 dB (Butterworth and Chebyshev I filters, respectively) as obtained from Tables 2 and 5. However, the price for this improvement in this case is an increase in filter order by 2 and 3 in the case of the Butterworth and the Chebyshev I filters (Tables 4 and 1, respectively), while Fc must increase. Based on the trade-off graphs provided by the methodology, the proposed design methodology not only leads to a small, well controlled implementation loss, but also gives insight in the filter parameters influence.
|
Table 5 | ||||
|
|
Butterworth |
Chebyshev-I |
Chebyshev-II |
Elliptic |
|
Implementation loss at BER = 10-5 (dB) |
0.14 |
0.15 |
0.05 |
0.10 |
Conclusion
It has been shown that the introduction of filters in the signal path of frequency domain equalization systems such as WLAN-OFDM reduce or even completely corrupt the BER system performance even if the filters meet their spectral specification. The cause of this BER degradation is ISI and ICI, as the filters in the signal path probably extend the length of the overall impulse response beyond the length of the guard interval. Acceptability of given filters can be analyzed based on BER simulations. Unfortunately, these simulations are time-consuming and do not provide direct insight in the cause of performance degradation. In this article, a model is presented to analyze given filters with respect to ISI/ICI and synchronization location, thus providing direct insight in the cause of the performance degradation. Based on this model, additional filter specifications apart from the filter mask are defined - the width of the synchronization range, the curve-gradient outside the synchronization range and the amount of SIR (ISI/ICI) within the synchronization range. Instead of analyzing given filters, an efficient system-level filter design methodology is also presented to define filter parameters according to cost constraints while having insight into the influence of parameter fluctuations. Using this methodology in a practical design case, the obtained filter reduced the implementation loss at BER = 10-5 by 4.9 dB compared to a filter designed by spectral specifications only.
References
1. Wolfgang Eberle, et al., "80 Mb/s QPSK and 72 Mb/s 64-QAM, Flexible and Scalable Digital OFDM Transceiver ASICs for Wireless Local Area Networks in the 5 GHz Band," IEEE Journal of Solid-State Circuits , November 2001.
2. R. Van Nee and R. Prasad, OFDM Wireless Multimedia Communications , Artech House Inc., Norwood, MA 2000.
3. S. Muller, et al., "Analysis of Frame- and Frequency-synchronizer for (Bursty) OFDM," CTMC Globecom , November 1998, pp. 201-206.
4. T. Pollet and M. Peeters, "Synchronization with DMT Modulation," IEEE Communications Magazine , Vol. 37, No. 4, April 1999, pp. 80-86.
5. G. Malmgren, "Impact of Carrier Frequency Offset, Doppler Spread and Time Synchronization Errors in OFDM-based Single Frequency Networks," GTC Globecom , Vol. 1, 1996, pp. 729-733.
6. B. Come, et al., "Impact of Front-end Non-idealities on Bit Error Rate Performances of WLAN-OFDM Transceivers," Microwave Journal , Vol. 44, No. 2, February 2001, pp. 126-140.
7. Patrick Vandenameele, et al., "An SDMA Algorithm for High Speed Wireless LAN," Globecom , November 1998, pp. 189-194.
B. Debaillie joined the DSP technology support group of IMEC in 1997, where he worked on system design, algorithm development, digital signal processing and DSP implementation of audio and telecom applications. In 2000, he joined the mixed-signal system design and RF group of IMEC, where he is now focusing on mixed-signal system design in the context of 5 GHz wireless LANs.
B. Come joined IMEC in the mixed-signal and RF applications group of the DESICS department. His main research interests are in the design of mixed-signal and RF front-ends for digital telecom system. For the past two years he has been working on system specification and architecture definition for WLAN transceivers, focusing on the RF module for which a single package solution is targeted. The driving applications for this project are HiperLAN/2 and IEEE 802.11a compliant transceivers.
W. Eberle joined the Wireless Systems Group of IMEC in 1997, where he has been working on system design, algorithm development, digital signal processing and VLSI implementation of digital OFDM-based wireless LAN modems. In late 2000, he joined the mixed-signal and RF applications group of IMEC, where he is now focusing on mixed-signal system design, signal processing and transmitter architectures in the context of 5 GHz wireless LANs. He is also working towards his PhD degree in electrical engineering at Katholieke Universiteit Leuven, Belgium.
S. Donnay works for IMEC, where he is now responsible for the mixed-signal and RF group. His current research interests are integration of RF front-ends for digital telecommunication applications, in particular 5 GHz WLAN front-ends, chip-package co-design, modeling and simulation of substrate noise coupling in mixed-signal ICs and modeling and simulation of RF front-ends.
H. Minami joined Sony Corp. in 1997, where he worked on system design for RF front-end, algorithm development and modeling for RF devices. He is now focusing on receiver architecture in the context of 5 GHz wireless LANs.