
Technical Feature
Spectrum Monitored Adaptive Feedforward Linearization
This article describes a method of maintaining the best cancellation of the distortion of a signal generated by a power amplifier. Prior papers and patents have proposed various linearizer structures and control algorithms. The design presented here consists of a feedforward linearizer's structure, with spectrum monitoring and control methods implemented. The system is examined with a two-tone excitation or a narrow-band CDMA single or multi-carrier excitation within the Korean PCS TX band operating frequency range. The results are a 38 to 45 dB reduction of the third-order intermodulation distortion (IMD) with a two-tone spectrum and 15 to 25 dB reduction of the spectral regrowth with a CDMA single or multi-carrier spectrum.
Jun Won Huh and Ik Soo Chang
Sogang University
Seoul, Korea
Chul D. Kim
Sewon Teletech Inc.
Seoul, Korea
Feedforward linearization reduces the distortion by vector subtraction of the two-path signals at the power amplifier output. The operation of the feedforward linearizer is simple in theory and the general structure is composed of two loops. The first is a carrier cancellation loop, and the second is a distortion cancellation loop. In the first loop, the operation is to reduce the main signal down to the distortion level. If this operation is not performed correctly, the auxiliary amplifier may be saturated. The second loop is important because the amount of cancellation depends on the precision of the amplitude and phase adjustment. In reality, the transfer function of the power amplifiers and sub-components in a feedforward system depends upon temperature, humidity, the types and powers of input signals, the DC power condition and the mean time between failure (MTBF) of all components. Thus, the second loop's adjustments must be sensitive and accurate for all conditions. For this reason, an adaptive control method is necessary for a powerful and stable feedforward system. This article describes a system which consists of the spectrum analyzing part of the final output and the adaptive control part of the distortion cancellation loop's adjusters using a microprocessor.
Feedforward Linearizer Types
Many approaches to adaptive feedforward systems appeared since the mid-eighties. These deal with two general methods1 - adaptive nulling and carrier (pilot signal) injection.
Adaptive nulling can be classified into two types. One is energy minimization, and the other is coherent detection. The energy minimization method has an inherent problem because it is impossible to distinguish the distortion energy from the overall spectrum energy by using standard detectors so the result cannot avoid being unsatisfactory. It can be modified by generating a second error reference signal from the output.2 The coherent detection method is based on continually computing estimates of the gradient of the object (the carrier or the distortion signals).3 The carrier injection method is well known. Nowadays, nearly all control schemes are based on digital data processing, which ensure the quality of a real telecommunication system.
This article presents a method where the system is monitored and controlled focusing on the individual spectrum components within the operating bandwidth (Korean PCS TX system) without either carrier injection or a look-up table.
|
|
|
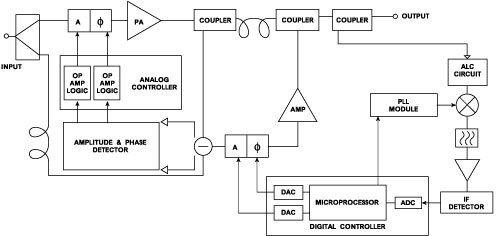
Fig. 1 The overall block diagram of the feedforward linearization structure. |
|
|
|
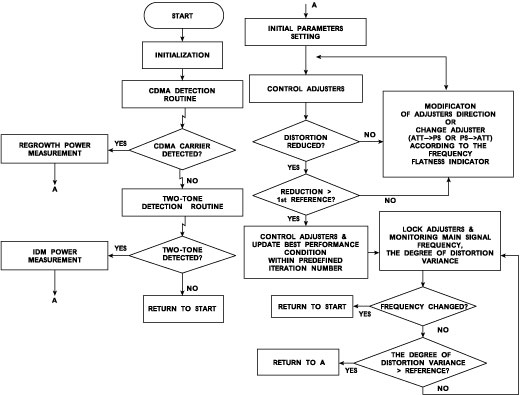
Fig. 2 The flow chart for the digital controller. |
Linearizer Design
The information monitored is processed in the frequency domain. There are three different design requirements for a spectrum analyzer which must be investigated in the operating bandwidth and dynamic ranges: measurement sensitivity, frequency selectivity and speed. In most cases, emphasis on one of the three requirements adversely impacts the other two. When measuring the spectrum with significantly different amplitudes and close spacing between the signals, the shape factor and 3 dB bandwidth of the resolution bandwidth (RBW) filters must be considered. A narrow bandwidth results in low noise level and increases the dynamic range but reduces the measurement speed. There are two different types of input signals considered for the power amplifier in this article. One is a CW two-tone signal, and the other is a CDMA signal. The regulation for a CW two-tone test deals with a carrier-to-interference power ratio (C/I) between distortions (IM products) and the main carrier signals. For the CDMA, the regulations deal with power spectral density ratios, measuring them with a mask that defines acceptable interference to other channels. Therefore a spectrum analyzer unit is implemented with a cascade of SAW filters (3 dB BW = 30 kHz) that separate the components of the spectrum, an automatic level control (ALC) circuit which locks on the spectrum components above the noise floor level, a high precision logarithmic IF amplifier that provides an accurate decibel measure of the input signal (the received signal strength indicator (RSSI) function) and a phase locked loop (PLL) module that controls the LO frequency in 10 kHz increments.
There are three control blocks in the linearizer presented. The role of the first block is to control the carrier signal elimination loop. That is implemented with operational amplifiers to maintain the desired degree of the cancellation of the carriers (analog type controller). The extraction of phase information is made with a 3 dB, 90° hybrid coupler in the form of in-phase/quadrature signals (I-Q). The role of the second block is control of the distortion signal elimination loop. The adjusters (amplitude attenuator and phase shifter) in that loop must be controlled carefully according to the degree of the reduction of distorted signal.
It is also necessary to check the frequency response (amplitude and phase) of the distortion signal elimination loop in order to achieve good performance.4 That frequency response has an effect on the convergence time and the degree of complexity of the control algorithm. However, it is impossible to get perfectly flat frequency responses of amplitude and phase, so it is necessary to define an indicator for the decision of frequency flatness for the fast convergence time and no confusion. (That indicator will be processed in the form of digital parameters in the microprocessor.) The equations of iteration are
DAC_att = DAC_att + DIR_att · WEIGHT_att (1)
DAC_ps = DAC_ps + DIR_ps · WEIGHT_ps (2)
where
att = attenuator
ps = phase shifter
DIR = sign of increment or decrement
WEIGHT = amount of increments
DAC = register value of digital-to-analog converter
In this implementation, the microprocessor monitors the status of spectrum (variance of the distortion and indicator of the frequency flatness) and controls the adjusters according to Equations 1 and 2 to the extent of pre-defined suppression levels. Once the appropriate results are achieved, the microprocessor changes the weights to minimum value for high precision and adjusts them to obtain optimal results within a pre-defined number of iterations. In the final step, the microprocessor memorizes the condition of adjusters and then fixes each adjuster. If the microprocessor controls the adjusters at all times after getting the optimal results, the perturbations of distortion must be due to the recursive calculations caused by the thermal drift of all components, the small variation of DC power, the quantization errors of the analog-to-digital converter (ADC) and so on. However, the monitoring processes run continuously to observe the status of the spectrum and the microprocessor updates the value of adjusters if the variance of distortion is greater than a tolerance or the conditions are changed (carrier frequency changes). The role of the third block is to control the PLL module for LO frequency for several different conditions. There is a close relationship between the second control block and the third one.
The overall block diagram is shown in Figure 1 . Figure 2 is the flow chart illustrating the operation of the digital controller (the second and third control block).
|
|
|
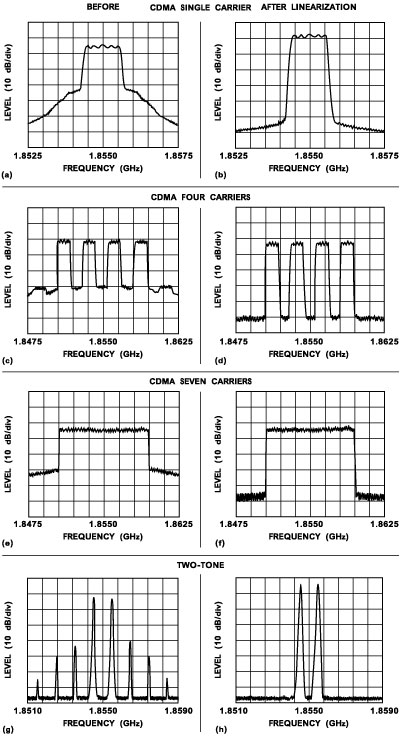
Fig. 3 Spectrums of the amplifier output for CDMA signals and two-tone signals before and after linearization. |
Results
The 1 dB compression point of the power output of the amplifier is 42 dBm and the auxiliary amplifier has about the same 1 dB compression point but operates with sufficient back-off to ensure that the nonlinear distortion is negligible. The feedforward linearizer system was tested when driven by various input powers and sources at various frequencies within the operating bandwidth. Figure 3 and Table 1 show the CDMA and two-tone spectrums of the power amplifier output port and the final linearized output port for various input signal conditions. Table 2 gives the calculation of the back-off power of the linearized system. The back-off is the difference between the CW1 tone compression power of the amplifier (42 dBm) and the average power output of the feedforward system.
|
| ||||||||||||||||||||||||||||||||||||||||||||||||||||
Conclusion
The feedforward method is most valuable in applications requiring wideband, high output power and high linearity. It is important to monitor the current conditions of the linearizer system to maintain the degree of the distortion reduction in a stable manner. Therefore, a spectrum monitored adaptive feedforward linearization system with a spectrum analyzer controlled by a microprocessor has been implemented. The results are a 38 to 45 dB reduction of third-order IMD for a two-tone spectrum and a 15 to 25 dB reduction of the spectral regrowth for CDMA single or multi-carrier spectrums (the near side spectral regrowth, that is, 885 kHz). Another result shows that a 1.5 dB back-off for two-tone and 3.7 to 4.3 dB back-off for CDMA single or multi-carrier cases are required to meet the given standards.
Acknowledgment
This work was supported by Brain Korea 21 projects.
References
1. P.B. Kenington, "High Linearity RF Amplifier Design,'' Artech House, pp. 304-312.
2. Ronald M. Bauman, "Adaptive Feedforward System,'' US Patent No. 4,389,618, June 21, 1983.
3. James K. Carvers, "Adaptation Behavior of a Feedforward Amplifier Linearizer,'' IEEE Transactions on Vehicular Tech ., Vol. 44, No. 1, February 1995.
4. P.B. Kenington, "Linear Distortion Correction Using a Feedforward System,'' IEEE Transactions on Vehicular Tech. , Vol. 45, No. 1, February 1996.
Jun Won Huh received his MSEE degree from Sogang University, Seoul, South Korea, in 1996.
Ik Soo Chang received his PhD degree from Seoul University, Seoul, South Korea, in 1982.
Chul D. Kim graduated from the University of Wisconsin at Madison in 1985.