
A New Spread-spectrum Measurement Method for Satellite Transponder In-orbit Testing
This article introduces a new measurement method for beginning-of-life and in-service testing of satellite transponders that utilizes spread-spectrum signals. The basics of this new method, which permit measurement of amplitude and group delay of a transponder channel, are presented. The advantages of the new method compared to existing methods are discussed and measurement results are presented that verify the applicability of the new method.
Thomas Kleine-Ostmann
Technical University
Braunschweig, Germany
Guy Harles
Société Européenne des Satellites
L-6815 Chateau de Betzdorf
Luxembourg/Europe
From the communication engineer's point of view, the core part of a satellite is the transponder, which receives signals from a ground station and retransmits them to home users. The signals can be FM analog video or quadrature phase shift keying (QPSK) modulated digital video broadcast-satellite (DVB-S) signals or any other kind of data used in point-to-multipoint applications.
In order to evaluate the integrity of a satellite transponder, it is necessary to measure its characteristics (frequency response, for example) and the characteristics of its high power amplifier (HPA), such as sensitivity and saturated output power. After the launch, these properties have to be measured in a beginning-of-life test, and since they are subject to aging, they have to be monitored regularly throughout the operation of the system to guarantee that they still meet the initial specifications. Hence, there are two main applications for transponder in-orbit testing which are beginning-of-life and in-service testing. The focus of this article is on the frequency response measurement method.
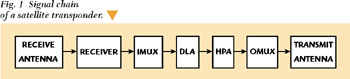
The signal path of a satellite transponder used for direct-to-home transmission (DTH) is shown in Figure 1. A signal that passes through a satellite transponder is first received and amplified in a low noise amplifier (LNA) at the satellite receive antenna and then frequency converted in the receiver. As the incoming signal usually consists of different FM or QPSK modulated carriers that are multiplexed using FDMA, the modulated carrier is selected from the signal by passing it through a demultiplexer. The demultiplexer is usually a bandpass filter (input multiplexer (IMUX)) that transmits the wanted modulated carrier and blocks the rest of the signal. Each modulated carrier has its own driver-limiter amplifier (DLA) and high power amplifier (HPA). The HPA is usually a traveling wave tube amplifier (TWTA). As the HPA usually operates in its nonlinear saturation region, it can only amplify a single signal in order to avoid distortion of the output signal due to intermodulation products. The amplifier output is then bandpass filtered (OMUX filter) again in order to prevent the transmission of broadband noise from the HPA and is then combined with the other amplified signals in the transmit antenna.
|
|
The bandpass characteristic of the transponder results from the IMUX and OMUX filtering. Usually the frequency response of the filter chain is measured with the help of a microwave link analyzer (MLA). It uses a frequency modulated carrier that sweeps over the measurement frequency region and measures amplitude response and group delay, similar to a network analyzer measurement. The group delay  G is determined by differentiating the measured phase Φ with respect to frequency f1 and is given by

The MLA needs a positive and sufficient signal-to-noise ratio to measure amplitude and phase. Therefore the payload on the satellite transponder has to be switched off, as the measurement signal would disturb the video or data signal. This is an important loss of efficiency in operation of the satellite. Another drawback of the MLA measurement is its inaccuracy due to amplitude-phase conversion (AM-PM) in the case of a high level measurement signal fed through a filter into a nonlinear amplifier. Furthermore, the frequency modulated MLA signal has a high spectral density, which may, under certain circumstances, lead to interference with nearby satellite systems, as will be explained later.
The application of spread-spectrum signals helps to overcome all of these disadvantages. Once the measurement carrier is modulated with a pseudo noise (PN) signal, the required signal level is much lower compared with an MLA measurement. The measurement can also be performed without switching off the transponder payload. As a PN signal has a very sharp autocorrelation at zero delay, it can be detected by correlation of the returned measurement signal with the known PN sequence. The detection is done with a delay locked loop (DLL) that accurately determines amplitude and group delay of the channel. Using the spread-spectrum measurement technique on an occupied transponder, the channel frequency response is measured under real operation conditions, whereas MLA measurements may not achieve these realistic conditions. For instance, the filters might not be heated up uniformly by the MLA measurement signal since it is a narrow band frequency modulated carrier with a different spectral density distribution than a real video payload. As a result of the low power level of the measurement signal, the disturbance of other channels is minimized in beginning-of-life tests as well as during in-service testing.
BASICS OF THE SPREAD-SPECTRUM METHOD
Pseudo Noise Modulation
A sequence of ones and zeros with certain statistical properties that is known in the transmitter and receiver but that looks like a random sequence is called a pseudo noise sequence. Once a measurement signal is phase-modulated with a PN sequence, it is possible to detect the measurement signal from a noisy environment, even with negative carrier-to-noise (C/N) values. This is possible because the PN sequence has a single, unambiguous peak in its autocorrelation function. By demodulating the received superposition of measurement signal and noise with the known PN sequence, it is possible to lock on the measurement signal even if it is 30 dB below the noise level.
The demodulation of the measurement signal is accomplished in a DLL that locks on the PN modulated signal and determines amplitude and group delay of the signal. PN sequences are generated using feedback shift registers. They are categorized depending on their length and statistical properties. An infinite length PN sequence has a triangular autocorrelation function. Triangular-shaped autocorrelation functions are optimal for signal detection. Hence a finite PN sequence is optimized with regard to its autocorrelation function being as close to a triangular shape as possible. Maximum length PN sequences are PN sequences with one main autocorrelation peak and the side peaks suppressed. They ensure a high processing gain when they are used for the transmission of a measurement signal because the probability of the DLL locking on a sidelobe instead of the main peak is minimized. Figure 2 shows the autocorrelation function of a maximum shift register PN sequence of length 31. Sequences like this are applicable in a practical measurement system. It can be seen that its shape is almost triangular and that the sidelobes are much smaller than the main peak.
 |
|
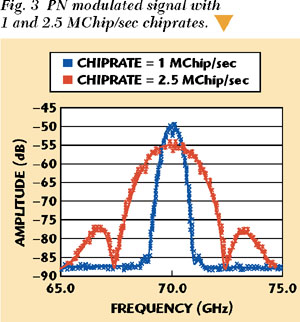
Once a clean carrier measurement signal is modulated with a PN sequence, its spectrum will no longer be a single peak but a spread 'sin(x)/x'-like spectrum. The power of the carrier wave is spread over a larger frequency region. The width of the PN modulated signal in the frequency region depends on the chip rate of the PN modulator, and the larger the chip rate, the wider the spectrum of the modulated signal. The shape of a PN modulated signal and its dependence on the chip rate is shown in Figure 3. The spectra are measured in a real spread-spectrum measurement system under laboratory conditions.
SIGNAL DETECTION
In order to be able to detect a PN modulated measurement signal, it is necessary to lock on the PN code for demodulation. This is done with a DLL. For the demodulation process, the PN sequence in the receiver must be synchronized with the incoming PN sequence. In a coherent DLL, the receiver is synchronized with the known phase from the transmitter. In the general case, the phase of the PN signal is retrieved from the measurement signal itself in a non-coherent DLL, as the transmitter phase might not be known.
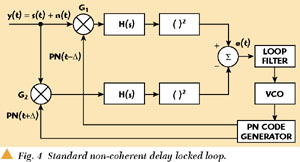
There are two main kinds of non-coherent DLLs that are described in this context. A block diagram of a standard DLL is shown in Figure 4. The input signal to the DLL is a data signal that is multiplied with a known PN sequence in the transmitter. This multiplication spreads the data signal and allows it to be detected from other signals. To recover the modulated signal, the input signal has to be multiplied with a synchronized replica of the PN sequence.
 |
|
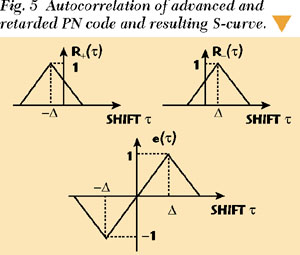
An input signal consisting of a PN modulated signal s(t) and noise n(t) is correlated with the known PN sequence. The signal is multiplied with an advanced and a retarded version of the PN code. These two replica of the PN code are 2Δ apart in time, where the time shift Δ must be smaller than the duration Tc of one chip of the PN sequence. To achieve a correlation, the multiplied signals are bandpass filtered with a filter H(s). Then the signals are squared and differenced to get an error signal that permits control of the PN code generator. Due to its characteristic shape, the error signal e( ) as a function of the correlator shift is called an S-curve. It can be seen in Figure 5 for a non-filtered (perfect square) PN sequence. The DLL exhibits a tracking error once the zero of the S-curve is no longer at the origin. The value of the S-curve at = 0 constitutes an error signal e(t) over time. By slightly sweeping the local PN sequence's position with regard to the received signal, the DLL locks on the incoming signal until the zero of the S-curve is reached and e(t) reaches zero. The loop error signal of a standard DLL can be calculated using Equation 2, where G1 and G2 denote the gain of the two correlation arms.
This shows that a gain imbalance G1 ≠ G2 causes a tracking error because the error signal that controls the VCO and the PN code timing is non-zero at the proper time shift t. Gain imbalance can become crucial because it is very difficult to implement the same gain in both arms due to electronic device tolerances, and it is almost impossible to maintain a balanced correlation due to the fact that aging changes device characteristics. Other methods for PN code tracking were considered that finally solved the problem of gain imbalance of the standard DLL. The Tau-Dither loop2 reduces hardware complexity due to the use of only one feedback arm that switches between an early and late path. Although it eliminates the problem of gain imbalance, it does not show the same tracking performance with regard to tracking jitter and acquisition behavior.
L.T. LaFlame3 was the first one to come up with a modification of the standard DLL that solved the problem of gain imbalance and maintained performance. This DLL was later modified by Yost and Boyd,4 who were able to reduce the hardware complexity of the LaFlame DLL.
|
|

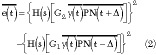
The LaFlame DLL is a modification of the standard DLL that was intended to eliminate the tracking error due to gain imbalance. Figure 6 shows an implementation of a LaFlame DLL. Instead of differencing the early and late correlation signals, the LaFlame DLL correlates the input signal with the sum and difference of early and late versions of the PN sequence, and multiplies the results in order to obtain the error signal. Equation 3 shows that the error signal is the same as for a standard DLL but that a gain imbalance G1 ≠ G2 does not shift the tracking point. This tracking principle is basically implemented in the measurement setup used for this evaluation.
BASIC PARAMETERS OF A MODEM IMPLEMENTATION
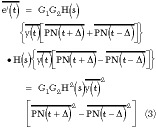
A LaFlame DLL was used for the implementation of the measurement system discussed in this article and is shown in Figure 7. A local oscillator provides the sweep signal from 50 to 90 MHz that is modulated with a PN sequence from a PN generator. This measurement signal is passed through the device under test (DUT), which is just a bandpass filter under laboratory conditions, instead of a real satellite transponder that might be in service. In the receiver module, the measurement signal is converted to a fixed IF center frequency and then applied to the LaFlame DLL where amplitude and group delay are determined for each point of the sweep. A typical transmission power for the test signal is approximately 30 dB below a typical video payload in a commercial satellite transmitter.
|
|
In order to be able to detect a measurement signal that is located 30 dB below the noise level, it is necessary to have a sufficient processing gain. The processing gain GP of a PN receiver depends on the ratio of chip rate and data transmission rate in the measurement channel according to Equation 4. Note that the measurement signal is usually a digitally modulated QPSK signal instead of the clean carrier measurement signal considered in the preceding introduction to PN modulation.

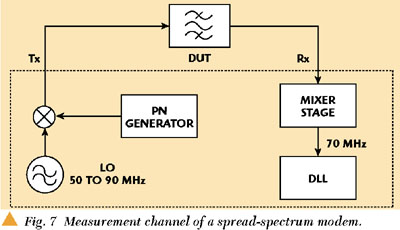
To obtain a sufficiently high processing gain, a data transmission rate of 1 kbit/s and a PN sequence from a fifteen-stage shift register (producing a chip length of 2n 1 = 32767) may be used to produce a signal of 32.767 Mchip bandwidth. In this case the processing gain becomes GP = 45.15 dB according to Equation 4, which is more than enough to detect a measurement signal from 30 dB below the payload signal. Figure 8 shows how the measurement signal, having a bandwidth of 1 kHz, is spread to almost the full channel bandwidth of 32 MHz and how the old measurement signal is recovered again in the receiver, despreading it with a local copy of the PN sequence.
|
|
In the case of measuring a satellite communication channel, the distance between ground station and satellite can change due to the movement of the satellite. A geostationary satellite may move in a radial direction with a speed of several m/s, leading to unacceptable group delay variation during the measurement time. Furthermore, the path loss between the ground station and the satellite might vary due to atmospheric effects. These problems are solved by using a reference signal located at a fixed frequency somewhere on the same transponder or even on a neighboring transponder on the same satellite. The desired frequency response of the communication channel can be obtained by subtracting the measured values of the reference signal from the values of the frequency sweep. Applying the new measurement method achieves accuracies of 0.1 dB in an amplitude sweep and 1ns in a group delay sweep.
The accuracy of the group delay sweep is consistent with a model for the timing error variance of a standard coherent DLL or a non-coherent DLL under the condition of a sufficient processing gain. According to Holmes,2 the standard deviation  DLL of the group delay timing error is given by Equation 5 as

where
TC = chip length
C/N0 = signal to noise ratio of the transmitted measurement signal
BDLL = tracking loop refresh bandwidth
APPLICATIONS AND ADVANTAGES OF THE SPREAD-SPECTRUM METHOD
The new spread-spectrum method has considerable advantages over the existing measurement methods. These advantages are discussed in this section as they concern frequency response measurements. Besides spread-spectrum, modems open a wide variety of further applications, including accurate range measurements between earth station and satellite, frequency translation and TWTA operation point measurements. Furthermore, they also allow measurement of all of these properties in a remote configuration with transmitter and receiver at different sites.
Transponder Testing with the State-of-the-Art Method
The state-of-the art method for measuring amplitude and group delay of a satellite transponder utilizes a microwave link analyzer (MLA). The transmitter of the MLA generates a frequency modulated signal, which is swept over the frequency band to be analyzed. The amplitude response is measured through the evaluation of the received signal level over frequency, whereas the group delay is determined from Equation 1.
There are two main scenarios for such satellite transponder in-orbit tests. Once the satellite is launched into its orbit, beginning-of-life (BOL) tests are performed in order to reevaluate the transponder characteristics that might have suffered during the launch. The second application is in-service tests during the operation of the satellite, without switching off the payload signal. In order to ensure quality of service, the deterioration of the channel characteristics due to aging must be observed.
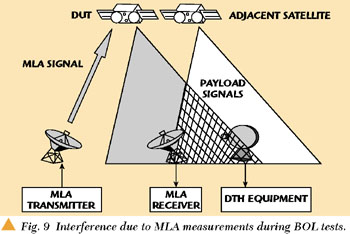
Figure 9 shows the situation during a BOL test with payload switched off. A ground station tests a satellite by transmitting a test signal through the transponder (DUT). This signal is also received in the DTH equipment of the end users of a nearby satellite, where it may generate interference and deteriorate the payload reception. Hence, prior to performing measurements on transponders with MLA signals (during BOL tests on a parking slot, for example, next to an operational satellite using the same frequency bands) the test signal uplinks must be coordinated between both satellites operators. As the geostationary arc becomes more and more crowded with Ku-band satellites, it is getting more difficult to find free orbital slots for BOL test purposes with standard measurement methods.
|
|
Advantages of the New Method
If the spread-spectrum method is applied, the situation is different and most problems that occur during testing using the MLA can be solved. The most important advantage is that the transmission power of the measurement signal can be about 30 dB less than in the MLA case. The problem depicted previously is no longer crucial since the satellite-transmitted measurement signal is below the noise level and does not influence the DTH users.
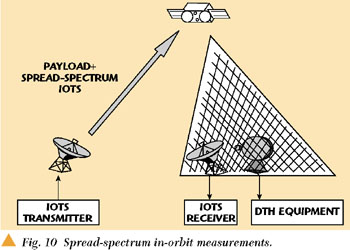
A completely new situation is also shown in Figure 10 for regular in-orbit tests. The payload signal and the in-orbit test signal (IOTS) are transmitted to the satellite transponder. The retransmitted signal is both detected by the IOTS receiver and the DTH home users. Since the PN modulated measurement signal does not affect the payload signal, there will be no lack in the quality of service of the measured transponder as well as in transponders of adjacent satellites. This kind of measurement is not possible with MLA signals, for the payload signal would be seriously deteriorated. Also, the MLA would not lock under these C/N conditions.
|
|
Another crucial point is that the measured transponder is working under real conditions whereas it is not during an MLA measurement. The MLA signal does not heat up the transponder hardware as under real load conditions, since the MLA signal must not drive the TWTA into saturation. Otherwise the group delay will no longer be measured correctly. It must also be considered that an MLA signal has a power spectral density mask completely different from a standard payload signal.
VERIFICATION OF THE SPREAD-SPECTRUM METHOD
Measurement of Bandpass Characteristics
The system described so far has been implemented into a real measurement system and measurements have been performed in a laboratory environment with a bandpass filter used as a DUT, which is suitable to model all types of transmission channels, not only satellite transponders. Figures 11 and 12 show the measurement results for amplitude and group delay compared with MLA measurements taken from the same DUT. It can be seen that both measurements match extremely well. A further advantage of using spread-spectrum signals is that it still correctly measures at high attenuations in the out-of-band regions of the filter where the MLA does not lock anymore. These measurements confirm the functionality of the new spread-spectrum method.
 |
|

Influence on Payload
In order to be sure that the new spread-spectrum method is suitable to measure amplitude and group delay while the transponder is in service, it is necessary to examine the influence of PN modulated measurement signals on video signal degradation. Analog FM-modulated video signals and digital QPSK-modulated DVB-S signals have been examined.
The analog video signal degradation has been examined in the baseband using a signal-to-noise ratio level meter. It has been found that there is no signal-to-noise ratio degradation if the PN signal is more than 27 dB below the video payload. This condition is met with the new measurement equipment, which locks 30 dB below the video payload. The digital video signal degradation has been examined with regard to the bit error rate (BER) which has to remain below a baseband video channel BER of 103 to ensure full quality of service. This specification is met under worst transmission conditions once the PN-modulated signal remains more than 14 dB below the video payload.
CONCLUSION
This article introduces a new spread-spectrum-based method for satellite transponder in-orbit testing. It can be seen that the new method has significant advantages over the conventional method to measure satellite transponder characteristics. The measurements are less disturbing for the commercial transponder operation, hence costs are reduced. The method is considered to be applicable after success was achieved in valid test measurements and after checking the influence of the measurement signals on the payload.
The application of this new method of measurement is not limited to satellite transponders. For example, the spread-spectrum modem may also be used for return-loss measurements by simply adding appropriate RF isolators. By combining both features, the new method could be used as a network analyzer replacement for specific DUTs. *
References
1. A. Jones and J. McManus, "The Measurement of Group Delay Using a Microwave System Analyzer," Microwave Journal, Vol. 43, No. 8, Aug. 2000.
2. J.K. Holmes, Coherent Spread-spectrum Systems, Krieger Publishing Co., FL, 1990.
3. D.T. LaFlame, "A Delay-lock Loop Implementation Which is Insensitive to Arm Gain Imbalance," IEEE Transactions on Communications, Vol. 27, No. 10, Oct. 1979, pp. 16321633.
4. R.A. Yost and R.W. Boyd, "A Modified PN Code Tracking Loop: Its Performance and Implementation Sensitivities," Harris Corp., FL, 1980.
5. R.C. Dixon, Spread-spectrum Systems with Commercial Applications, Wiley & Sons, NY, 1994.
6. M.K. Simon, J.K. Omura, R.A. Scholtz and B.K. Levitt, Spread-spectrum Communications Volume III, Computer Science Press, ML, 1985.
Thomas Kleine-Ostmann studies electrical engineering at Technical University Braunschweig. He received a M. Sc. degree in electrical engineering from Virginia Polytechnic Institute and State University in 1999 and now specializes in high frequency engineering working toward his German university diploma. He worked on the spread-spectrum IOT method during a three month internship at Société Européenne des Satellites.
Guy Harles studied electrical engineering at the RWTH Aachen and the ENSPS Strasbourg. He received his degree in 1996. Since then, he is working as earth station engineer at Société Européenne des Satellites (SES-Astra ), focussing on advanced in-orbit test and ranging system projects. His was the project responsible for the verification and implementation of the spread spectrum IOT system. Harles may be contacted at Guy_Harles@ses-astra.com.