
PRODUCT FEATURE
="BANNER"> Using APLAC to Simulate an RFIC Mixer
APLAC Solutions Inc.
Irving, TX
Mixers are important RF elements in modern communication devices. As the size of devices is reduced, RF integration is increased. Using the APLAC Design Suite, integrated mixer circuitry can be simulated using the RFIC Design Module and RF Board Module, which extend APLAC's simulation and modeling capabilities to high frequency analysis. Nonlinear characteristics such as gain and noise are clearly displayed, as component variation effects are determined and optimized.
HIERARCHICAL MIXER DESIGN
A hierarchical mixer design is shown using three schematic diagrams. The MIXER schematic, shown in Figure 1, displays the measurement setup with the required matching and biasing definitions. The MATCHING schematic, shown in Figure 2 and included as a submodel in the MIXER schematic, displays the differential matching circuitry built on a printed circuit board. Also included as a submodel in the MIXER schematic, the MIXER_CELL schematic (Figure 3) displays an integrated mixer design of a Gilbert cell type, in this case a differential configuration. The Gummel Poon transistor model with simple parameter setup is used.
|
|


DEFINING MULTI-TONE HARMONIC BALANCE ANALYSIS
Using APLAC's multi-tone harmonic balance analysis, the integrated mixer circuit can be simulated using a variety of excitation frequencies. In this case, an 800 MHz local oscillator signal is used in combination with an input signal of 900 MHz. These independent signal frequencies have been defined as APLAC variables, shown in the text box in the MIXER schematic with the names flo and fsig, respectively. Excitation and load components are connected to the mixer circuitry before simulation begins.
|
|


The Prepare statement, shown in Figure 4, defines the number of independent excitation frequencies used and the maximum order of their mixing products in harmonic balance. In this simulation, TONE 2 4 means two excitation frequencies and up to a fourth order of mixing, or 20 frequency components in result vectors in addition to DC.
The input signal (IN) is defined as a voltage source with impedance R = 50 Ω. The source value is defined by function udBm (Pin), where Pin is a variable with a nominal value of 20 dB. The function udBm returns the peak voltage value, in this case a 50 Ω resistor having maximum available power 20 dBm.
This signal uses the second independent frequency defined (command TONE[0,1]). The local oscillator signal is differential with the first fundamental frequency (TONE[1,0]) with an amplitude of 0.2 V and a DC offset of 1.7 V. The load is purely resistive with value (Rout) of 50 Ω.
The sweep command is used to activate the simulation, indicating harmonic balance analysis with HB and using an FC vector to define excitation frequencies and their order. Results are displayed with Display and Print statements.
Two results windows are requested (W = 0 and W = 1), the first one for spectral results and the second for waveform results, as shown in Figures 5 and 6, respectively.
|
|
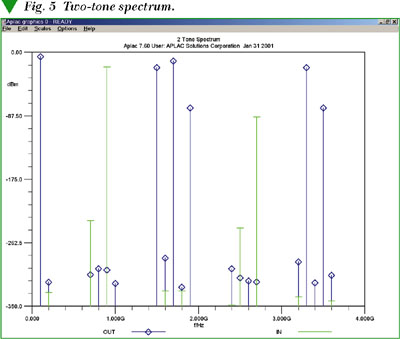

At the simulation's conclusion, the conversion gain is calculated by dividing the output spectrum component f2 f1 (mixing product) by the input spectrum component f2 (input signal).
COMPRESSION ANALYSIS
APLAC harmonic balance analysis can be looped to highlight the effects of increased input power, showing how conversion gain behaves as a function of input signal amplitude. Previously defined excitations and load are used, with input power ranging from 30 to 5 dBm. The conversion gain is displayed and printed graphically, as shown in Figure 7, and as text showing numeric values. LOOP statements can be used to automate the study of virtually any relevant factor.
|
|

Clearly, mixer gain decreases due to nonlinearity in semiconductor models. Using harmonic balance analysis, APLAC simulates all standard nonlinear characteristics, such as input/output interception points, for any type of RF circuit.
REVEALING INPUT IMPEDANCE
In this example, the inductance value of bonding wire from the printed circuit board to the chip is not indicated. APLAC can display the effects of possible inductance value variations. Inductances L5 and L6 representing the bonding wires are defined using APLAC variable Lp, shown in the MIXER schematic.
Instead of the voltage source, current excitation is used, as shown in Figure 8. The current amplitude is defined as APLAC variable Iin with a nominal value of 1 µA. The source impedance is 1M Ω in parallel with the current source.
 |
As "output," the input impedance is calculated using Ohm's law, and the input reflection coefficient is calculated using impedance Zin
![]()
Using harmonic balance analysis, APLAC returns voltage and current vectors with complex values. A complex variable can be defined for the input impedance at each analysis point, or for every inductance value covered by the Sweep. In the APLAC analysis definition listed in Table 1, the first line accounts for complex impedance Zin definition. The Display statement shows impedance and S11 calculations. All lines between the LOOP statement and the Display command are used to define the customized layout of the two results windows.
 |
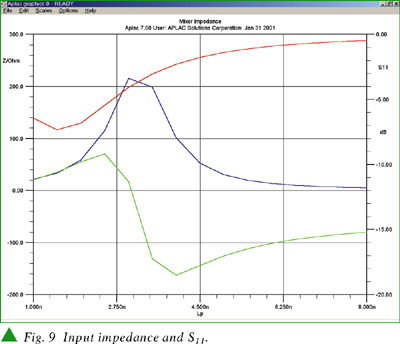
Values Zin and S11 are drawn as a function of the bond inductance value, which APLAC has used as the simulator loop parameter. Real and imaginary parts of Zin are drawn separately, as shown in Figure 9, using the RI flag for Display. Optimal input matching is achieved as the real part of Zin approaches 50 Ω.
|
|

The input reflection coefficient S11 is shown on a Smith chart in Figure 10. The APLAC's pointer tool is activated, and crosshairs indicate the fourth analysis point. The window's title bar displays two values: the loop variable, which is the inductance value in this case, and input reflection coefficient S11 in complex number format. APLAC can use multiple optimization methods to uncover the best possible input matching circuit design.
MEASURING NONLINEAR NOISE
APLAC uses a special simulation technique with harmonic balance analysis to measure nonlinear noise. Large-signal/small-signal (LSSS) noise analysis makes a linear small-signal analysis after each multi-tone harmonic balance large-signal analysis.
Multi-tone analysis is defined preceding LSSS using the TONE identifier. In Figure 11, harmonic balance analysis is defined with one excitation signal and fourth order mixing products. A 'weak' signal excited by port components will be added to the 'strong' HB signal.
 |
The HB excitation signal is the first one in the FC vector, equal to fsig-103Meg or 797 MHz, and the small-signal (or weak signal) is fsig or 900 MHz. The loop variable used in this example is the analyzer's internal temperature, looped from 30 to 125° C.
Graphical output, shown in Figure 12, includes the single and double sideband noise figures as functions of temperature. Noise contribution and noise power are printed in order of contribution. Noiseless components are removed from the output list.
 |
CONCLUSION
APLAC can simulate circuits of almost any type using a broad range of analysis methods. The versatile harmonic balance analysis is a single example of the simulator's powerful flexibility. Driven with an effective scripting language, APLAC allows optimal adaptability and elasticity in the specification of analysis tasks.
APLAC has been successfully applied to a huge range of design problems. Technology leaders use this tool extensively in their RF simulation and design work at IC and board levels. APLAC's most commonly cited benefits are increased productivity, faster design cycles and a more accurate match between simulated results and the final product.
APLAC Simulation files for this example are available along with an article on RFIC Simulations from the APLAC Knowledge Base, accessible at www.aplac.com. Detailed syntax descriptions are also available in APLAC on-line manuals. A free APLAC evaluation license may be obtained by contacting sales@aplac.com. The complete APLAC Design Suite is available starting at $23,000 and other specialized versions start from $8500, depending on the application.
APLAC Solutions Inc.,
Irving, TX (972) 719-2562.
Circle No. 301