
 Measured Results
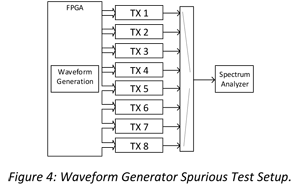
An eight channel transceiver based RF testbed was assembled to evaluate the transceiver product line for phased array applications. The test setup for evaluating the waveform generators is shown in Figure 4. For this test the same digital data is applied to all waveform generators. A calibration is performed across the channels by adjusting the NCO phase to ensure the RF signals are in phase at the 8-way combiner and coherently combine.
Next we will show test data comparing spurious with the LOs and NCOs all set to the same frequency vs spurious when the LOs and NCOs are offset in frequency. The transceivers used share an LO within a two channel device (see Figure 1), so for the eight RF channels there are four different LO frequencies.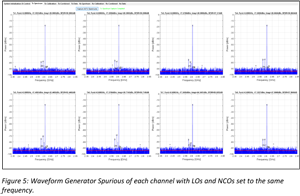
In Figures 5 and 6 the transceiver NCOs and LOs are all set to the same frequency. In this case the spurious signals produced from the image, the LO leakage, and the third-harmonic, are all at the same frequency. Figure 5 shows the individual transmit outputs measured on a spectrum analyzer. Figure 6 shows the combined output. In this particular test the spurs of the image and the LO leakage measured in dBc relative to the carrier showed improvement, but the third-harmonic did not improve. In our testing we found the third-harmonic was consistently correlated across channels, the image frequency was consistently uncorrelated, and the LO frequency varied depending on startup conditions. This is reflected in Figure 3a where we show coherent addition for the third-harmonic, non-coherent addition for the image frequency and partially coherent addition for the LO leakage frequency.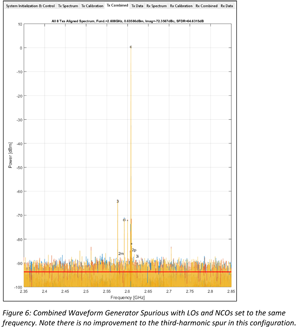
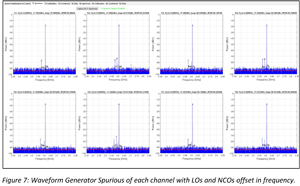
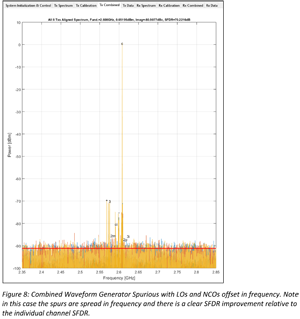
In Figures 7 and 8, the transceiver LOs are all set to different frequencies and the digital NCOs are adjusted in both frequency and phase such that the signals coherently combine. In this case the spurious signals produced from the image, the LO leakage, and the third-harmonic, are forced to be at different frequencies. Figure 7 shows the individual transmit outputs measured on a spectrum analyzer. Figure 8 shows the combined output. In this test the spurs of the image, the LO leakage, and the third-harmonic measured in dBc relative to the carrier begin to spread into the noise and every spur shows an improvement when channels are combined.
 When a very small number of channels are combined, as was done in this test, the spurs actually show a 20log(N) improvement in their relative levels. This is due to the signal components combining coherently and adding as 20log(N) while the spurs do not combine at all. In practice, with a large array and a much greater number of channels being combined, the improvement is expected to approach 10log(N). This is for two reasons. First, with a large number of signals being combined it will not be practical to spread the spurs out sufficiently such that each one can be considered in isolation. Consider a 1 MHz modulation bandwidth as an example. If a specification says that spurious emissions are to be measured in a 1 MHz bandwidth then ideally the spurs would be spread out so that they are at least 1 MHz apart. If this is not possible then each 1 MHz of measurement bandwidth will include multiple spurious components. Since these will be at different frequencies they will combine incoherently and the spurious power measured in each 1 MHz of bandwidth will increase as 10log(N). However, no single 1 MHz of measurement bandwidth will contain all the spurs so in this case "N" for the spurs is smaller than "N" for the signal and although the incremental improvement will be 10log(N) once N is large enough for the spurious density to place multiple spurs inside the measurement bandwidth the absolute improvement will still be better than 10log(N) compared to the system without spurious signal decorrelation, i.e., it will be somewhere between 10log(N) and 20log(N) dB better. Secondly, this test was done with CW signals but real world signals will be modulated and this will cause them to spread out, making non-overlapping spurious signals impossible to achieve when a large number of channels are combined. These overlapping spurious signals will be uncorrelated and add incoherently, as 10log(N), in the overlap region.
 It is worth making special mention of the LO leakage component when the LO is set to the same frequency across channels. The LO leakage is due to imperfect cancellation of the LO in the analogue modulator when two signal branches are summed. If the amplitude and phase imbalances are random errors then the phase of the residual LO leakage component will also be random and when many different transceivers' LO leakages are summed they will add incoherently, as 10log(N), even when they are at precisely the same frequency. This should also be the case with the modulator's image component but not necessarily the modulator's third harmonic. With a small number of channels being coherently combined it is unlikely the LO phases would be completely random and thus the cause for partial decorrelation shown in the measured data. With a very large number of channels the LO phase approaches a much more random condition across channels and thus anticipated to be an uncorrelated addition.