
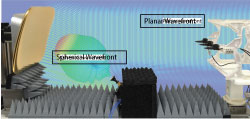
Figure 2 Compact antenna test range with a roll-edge reflector collimating a spherical wavefront into a planar wavefront.
HARDWARE NEAR-FIELD TRANSFORMATIONS
Alternative testing methods enable OTA assessment in the near field without a software transformation, rather a hardware-based one. The idea is to physically create far-field conditions in a specified quiet zone region within a short range. This is known as “indirect far field.” A compact antenna test range (CATR) uses a mirror to transform a spherical wave into a planar wave and vice-versa. Using Fermat’s principle of least time, a planar wave can be focused on a single point using a parabolic mirror. If a measurement antenna is placed at this focal point, using the reciprocity principle, a plane wave can be generated as the parabolic mirror reflects a certain planar component of the incoming spherical wave from the measurement (or feed) antenna into the quiet zone where the DUT is placed (see Figure 2).
The error inside a CATR system comes from two main sources: the mirror geometry—the edge treatment and smoothness of the surface which limit the frequency range—and the feed antenna characteristics. If the reflector is built with a simple parabolic section, the sharp edges cause diffraction, which significantly contaminates the quiet zone by producing ripples as large as 2 dB. Techniques to mitigate this phenomenon include serrations and rolled edges to scatter the energy away from the quiet zone. The size and shape of the serrated/rolled edges determine the lowest operating frequency, where the surface roughness determines the upper frequency. Feed antenna pattern characteristics have a direct impact on the size of the quiet zone, as the mirror essentially projects the radiation pattern of the feed antenna onto the quiet zone. The reflector size with serrated/rolled edges is generally at least 2× the DUT/quiet zone size, where a reflector with sharp edges is 3 to 4× the size of the quiet zone. The optimum reflector to DUT separation distance is (5/3)× the focal length of the reflector. An optimal focal length can be derived from the manufacturing shape tolerances with a range of roughly 0.3 to 1 for the ratio of focal length to parabolic diameter.
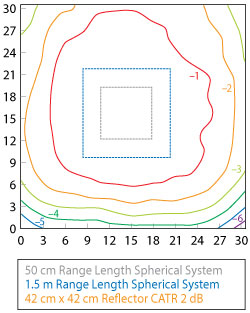
Figure 3 28 GHz, 2 dB amplitude taper quiet zones for a roll-edge compact range system vs. direct far-field systems.
Since the quiet zone size is dependent on the reflector characteristics instead of range length, it is much easier to create a large quiet zone inside small enclosures. Figure 3 shows the measured magnitude quiet zone size of 27 cm at 28 GHz of a CATR, similar to the one shown in Figure 2, with a 42 cm × 42 cm reflector. This CATR setup fits within a chamber as small as 2 m × 1.5 m × 0.85 m. A direct far-field measurement system featuring the same quiet zone size would require a
14.5 m range.
Such technologies are of great interest for testing UEs or base stations operating in 5G NR FR2, promising a significant decrease in the size of test environments. In addition, CATR has the same capabilities as a far-field system, i.e., instantaneous and direct measurements of RF transceiver performance in both Tx and Rx. As the path loss of such a system only occurs between the limited region where waves propagate between the feed and the reflector, the dynamic range of a CATR system is better than a direct far-field approach. Using Figure 3 as an example, the CATR system has a focal length of 0.7 m compared to the equivalent far-field range length of 14 m, resulting in a path loss difference of 26 dB.
PLANE WAVE SYNTHESIS
A CATR reflector is typically built using a solid piece of aluminum to maintain the strict surface geometry requirements. The 5G FR2 DUT size requirements allow for compact and rather light reflectors (20 to 40 kg). In the 5G FR1 range, reflector weight significantly increases, up to hundreds of kilograms for base station DUTs. The cost, fabrication time and handling of large heavy mirrors becomes prohibitive. A lightweight and cost-effective alternative is to use an “electronic version” of the CATR mirror.3 By combining the radiation of multiple antennas assembled in a phased array and fed with pre-determined signal magnitude and phase, a plane wave within a defined quiet zone is created. A version of this near-field focusing technique was used for several years for the measurement of large phased array radars at MIT Lincoln Labs and has been proposed as an OTA measurement baseline for base stations by 3GPP.5
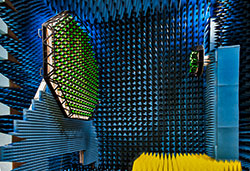
Figure 4 R&S PWC200 showing the PWC antenna array and calibration array mounted on a great-circle cut positioner.
Figure 4 shows the plane wave converting (PWC) system reported at the 2018 European Conference on Antennas and Propagation.3 It comprises an array of 156 wideband Vivaldi antennas with a beamforming network of phase shifters and attenuators, located at the rear. This PWC array is 1.8 m wide and creates a spherical quiet zone of 1 m diameter at a distance as short as 1.5 m in the frequency range from 2.3 to 3.8 GHz. In the setup of Figure 4, the DUT (here the calibration antenna) is mounted on a combined axis positioner, enabling full spherical measurement. The calibration antenna is used for evaluating the appropriate compensations of the individual RF channels of the PWC array, as well as determining the path loss of the entire test system. The PWC system is reciprocal and has only one RF input/output which can either be connected to a signal generator, a spectrum analyzer or a VNA, enabling measurement of devices with or without RF test ports.
Figure 5 shows the single-carrier EVM measured with the PWC for an OFDM signal with five 20 MHz carriers in the range of 2.35 to 2.45 GHz, using a Rohde & Schwarz vector signal generator. The output power is 5 dBm and fed into a 60 cm × 60 cm patch array DUT. The demodulation is carried out by a Rohde & Schwarz vector signal analyzer connected to the PWC, where the measurement span is 30.72 MHz. The EVM is as low as 0.41 percent, roughly corresponding to the internal EVM of the measurement instruments. EVM results were below 0.5 percent for the other four carriers, showing that the PWC adds negligible EVM to the measurement setup.
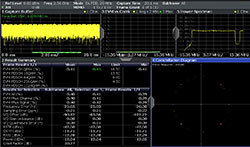
Figure 5 EVM of a single 20 MHz carrier measured using the R&S PWC200.
SUMMARY
Near-field techniques employing software transformations are suitable for evaluation of EIRP and TRP quantities. When Rx or demodulation is involved with a DUT using multiple non-identical RF transceivers, methods utilizing hardware field transformations such as CATR and PWC overcome the limitations of software NF-FF. They also provide compact and reliable alternatives to direct far-field measurements, making them well-suited for 3GPP RF conformance testing of UEs and base stations.
References
- C. L. I, C. Rowell, S. Han, Z. Xu, G. Li and Z. Pan, “Toward Green and Soft: A 5G Perspective,” IEEE Communications Magazine, Vol. 52, No. 2, February 2014, pp. 66–73.
- B. Derat, “5G Antenna Characterization in the FF,” IEEE EMC & APEMC 2018, Singapore, May 2018.
- C. Rowell and A. Tankielun, “Plane Wave Converter for 5G Massive MIMO Base Station Measurements,” 12th EuCAP2018, London, U.K., April 2018.
- Derat et al., “A Novel Technology for Fast and Accurate Specific Absorption Rate Measurement (SAR),” iWAT, Karslruhe, Germany, March 2013.
- Rohde & Schwarz, “2D Compact Range for Testing of AAS Base Stations,” TSG-RAN WG4 #87, R4-1806605, May 2018.