
SOLR Calibration for Grounded Coplanar Waveguide Lines
Shay Gross, Lawrence P. Dunleavy and Thomas M. Weller
University of South Florida, Department of Electrical Engineering, Wireless and Microwave (WAMI) Program
Tampa, FL
This article examines short-open-line-reciprocal (SOLR) calibration of grounded coplanar waveguide (GCPW) lines. The calibration is made possible by using the WinCal software. The standards used for the calibration, including a knee type of discontinuity, were measured and the results are described. The measured standards are shown after the calibration process, and a measured 90° bend is compared with predictions made by the Sonnet EM simulator. The results confirm that SOLR is a valid calibration procedure.
The first step in any vector network analyzer (VNA) probe measurement is the calibration process. There are several well-known methods to calibrate the instrument to the tip of the probes or to some reference plane away from the probes. Calibration types such as thru, reflect, line (TRL); short, open, load, thru (SOLT); and line, reflect, match (LRM) have proved to be accurate and relatively easy to perform, but with one common restriction: The probes must be in line. The SOLR calibration makes no assumptions about the transmission standard used other than that it must be reciprocal (S12 = S21 ). A significant advantage of this permutation of the SOLT calibration is that it is applicable to orthogonal probing systems where the thru standard is difficult to implement. In an orthogonal probing environment, a transmission line with a 90° bend suffices for the reciprocal standard. The SOLR technique was suggested by Ferrero1 and has been implemented in Cascade Microtech's WinCal software.2 Basu and Hayden3 provide a good overview of the basics of this technique.
This article presents an effort to achieve an acceptable SOLR calibration on GCPW lines using the WinCal software. Some basic theory is given for those individuals interested in the concepts behind the SOLR method, and the definitive process of standard definitions is described. After each calibration process, the standards were measured and examined to explore calibration accuracy.
CALIBRATION STANDARDS STRUCTURES
The calibration standards structures used in this research (and shown in Figure 1) are the same as those previously presented by the authors.4 The four standards are GCPW lines fabricated on an FR-4 substrate with an effective dielectric constant of 2.57 and a characteristic impedance of 92 W . The actual characteristic impedance of the lines was measured using MultiCal and Cap software by NIST and is shown in Figure 2.5 Those results showed a good comparison to predictions made using Linecalc software.6


One of the important issues of SOLR calibration using the WinCal software is to know exactly the capacitance introduced by the open standard, the inductance introduced by the short standard and the inductance introduced by the load standard. The models utilized for the three standards are shown in Figure 3. The model element values were found through optimization to data measured using a reliable TRL calibration. The optimization process was accomplished using EESof Series IV,6 and the results are shown in Figures 4, 5 and 6.


RESULTS
The calibration parameters were computed and downloaded to a Wiltron 360 VNA using WinCal, and the various standards were re-measured, this time with SOLR calibration. The calibration process was repeated a number of times until the results were consistent. No two calibrations can ever be identical due to repeatability errors, noise and drift in the system, but the results appeared to be consistent and reliable.
The best way to examine the validity of a calibration is to measure the same device under test using an additional calibration method and compare the results. Since special structures that are required for any additional calibration methods were not available, an alternative way to check the validity of the SOLR calibration is simply to observe the results and examine them with regard to the expected/calculated values. This way it can be determined if the calibration is fairly accurate, but not how accurate it is compared to any other method.
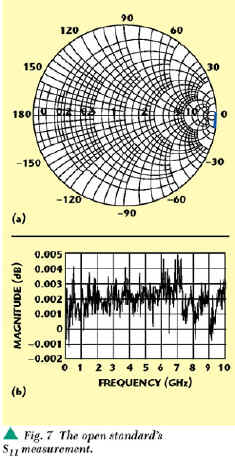
First, by looking at the measured open standard data, as shown in Figure 7, it can be seen that the reflected signal is less than ±0.005 dB with a phase of less than 5°, compared to an ideal case of 0 dB/0°. The same trend is observed when the short standard is examined. Figure 8 shows that the reflected signal is less than ±0.011 dB with a phase of 12°. The results are not as good as in the case of the open; the phase seems to be somewhat higher than expected, but is still in an acceptable range.

Next, the load standard is examined. Looking at the Smith chart representing S11 of the load, as shown in Figure 9, it is clear that the load resembles a 50 W resistor with a parasitic series inductance. By selecting a single set of measured data from the load, with a known frequency and the normalized imaginary value, it is possible to calculate the value of the parasitic inductance such that

f = frequency at sampled data point
= 10 GHz
Load impedance at sampled data point:
|
Resistor |
= |
50 (1.00756 + j1.52283)W |
|
|
= |
50.378 + j76.141W |
|
|
|
(unnormalized) |
jX = jw L (w =2P f)
where
X = Im(resistor)

Note that the measured resistance of the load is 50.378 W compared to 50.4 W , which was measured directly on the resistor using an ohmmeter. Furthermore, the measured reactance is 1.212 nH compared to 1.210 nH, the value of the series inductance used in the load's model. The model for the load was based on a TRL measurement and an optimization process; the fact that both reactances agree increases the confidence in the SOLR calibration.
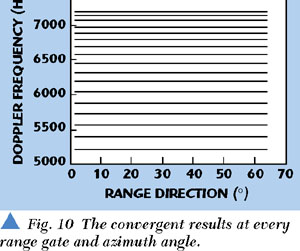
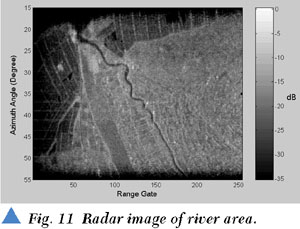
Perhaps the most interesting results are those shown in Figures 10 and 11. Using the Sonnet Suite EM simulator,7 the knee type of the previously shown structure was simulated. The same knee was measured with the SOLR calibration and compared to the simulated results. The S11 results are in a good agreement through 6 GHz, with some noticeable phase deviation above that. The S21 results show tracking in shape through the same frequency; however, there is more loss in the measured data. It is surmised that the loss is due to radiation and conductor losses that were not accounted for in the EM simulation.
CONCLUSION
The measurement results show that a good SOLR calibration using GCPW lines is feasible. Orthogonal on-wafer measurements were successfully completed with an SOLR right-angle calibration. The use of a bend in the orthogonal calibration does not appear to cause significant error. In the case where WinCal is used for the SOLR computation, an important step is to make sure that accurate models for the standards are in hand; otherwise, the calibration will not succeed. It is crucial to make sure that the optimized standard models rely on an accurate reference calibration to guide the process.
ACKNOWLEDGMENT
The authors would like to thank Linda Jaffe of Cascade Microtech for making WinCal available, Leonard Hayden of Cascade Microtech for his valuable review comments, Jim Rautio of Sonnet for providing the em software and Bert Schmitz of M/A-COM, Roanoke, VA, for providing the GCPW test structures used here and in a related project funded by the same organization. *
References
1. A. Ferrero, "Two-port Network Analyzer Calibration Using an Unknown Thru," IEEE Microwave and Guided Wave Letters, Vol. 2, No. 12, December 1992, pp. 505?507.
2. Cascade Microtech, 2430 NW 206th Ave., Beaverton, OR.
3. S. Basu and L. Hayden, "An SOLR Calibration for Accurate Measurement of Orthogonal On-wafer DUTs," 1997 MTT-S International Microwave Symposium Digest, Denver, June 1997.
4. S. Gross and L. Dunleavy, "PC Board Characterization Using Accurate Hybrid Probing Techiques," 53rd ARFTG Conference Digest, 1999.
5. Agilent Technologies Inc., 3000 Hanover St., Palo Alto, CA.
6. R.B. Marks and D.F. Williams, "Characteristic Impedance Determination Using Propagation Constant Measurement," IEEE Microwave Guided Wave Letters, Vol. 1, No. 6, June 1991, pp. 141143.
7. Sonnet Software, 1020 Seventh North St., Suite 210, Liverpool, NY.
 Shay Gross received his BSc and MSc degrees in electrical engineering from the University of South Florida, Tampa, in 1998 and 2000, respectively. His research focused on passive components modeling. Currently, Gross is employed by Intel Corp. in Israel.
 Lawrence P. Dunleavy received his BSEE degree from Michigan Technological University in 1982, and his MSEE and PhD degrees in 1984 and 1988, respectively, from the University of Michigan. He has worked in industry for E-Systems and Hughes Aircraft Company and was a Howard Hughes Doctoral Fellow. In 1990, he joined the electrical engineering department at the University of South Florida, where his is now an associate professor. From August 1997 to August 1998, he enjoyed a sabbatical research appointment with the Microwave Metrology Group of the National Institute of Standards and Technology (NIST) in Boulder, CO. His current research interests are in the area of accurate microwave and millimeter-wave measurements, measurement-based active and passive component modeling, MMIC design, and wireless systems characterization and CAD. Dunleavy is a senior member of IEEE, and is very active in the IEEE MTT Society and the Automatic RF Techniques Group (ARFTG). He has authored or co-authored more than 60 technical articles.
 Thomas M. Weller received his BS, MS and PhD degrees in electrical engineering in 1988, 1991 and 1995, respectively, from the University of Michigan, Ann Arbor. He is currently an assistant professor in the electrical engineering department at the University of South Florida, Tampa. His research involves micromachining applications for microwave and mm-wave circuits, packaging, electromagnetic modeling and mm-wave sensors. Weller was a co-recipient of the 1996 Microwave Prize from the IEEE MTT Society, and has published more than 40 papers in his field.