
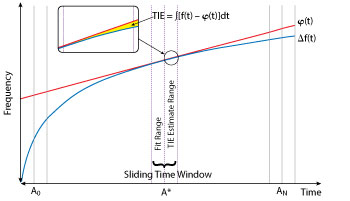
Figure 1 TIE estimation algorithm.
TIE MEASUREMENT PROCEDURE
TIE measurements are done for 3 to 7 days with periodic temperature changes. A measurement duration of 3 to 7 days is necessary to count and compensate for frequency drift due to aging. In general, it may be possible to compensate for aging in holdover mode in case there is a long term record of frequency output of a precise frequency source obtained while synchronized to an external reference. It is possible to create learning systems capable of aging compensation basing on data from the last 2 to 3 days of operation.
TIE estimation, which takes into account compensation for aging, is carried out as follows (see Figure 1):
- Choose the beginning of TIE estimation (start of the “sliding” time window). The sliding time window, moving with some step (1 to 4 hours), is applied to the data. This window consists of two parts: Fit range and TIE estimate range.
- Approximate aging. The frequency aging approximation φ(t) is built basing on readings situated inside the fit range. The fit range lasts 24 hours. According to our research, this is most optimal for the aging approximation.
- TIE estimation. Readings situated inside of the TIE estimate range are used for determining the subject time error. The time error in this range is determined by the difference between the frequency readings and the aging approximation:
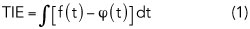
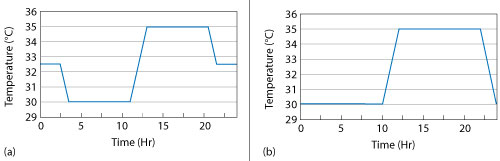
Figure 2 Temperature profiles for TIE estimation: symmetrical (a) and asymmetrical (b).
Figure 3 24-hour TIE for a DOCXO: temp- erature profile during the test (a), measured frequency (b) and estimated TIE (c).
The TIE estimate range is 4 to 24 hours.
A TIE of 100 to 400 ns in holdover mode for telecom and mobile networks is used primarily for grand masters, which are installed in environmentally conditioned rooms. This means that the temperature change during the day usually does not exceed 5 Centigrade degrees.
Different temperature profiles can be used for TIE estimation. Two are presented in Figure 2. It should be mentioned that the profile of Figure 2a is symmetrical with respect to the average temperature change. Thus, the time error accumulated over 24 hours along this profile should be equal to 0 (under ideal conditions). The profile shown in Figure 2b does not have symmetry, so even under ideal conditions there is a net time error accumulated over 24 hours.
For TIE estimation we use the temperature profile from Figure 2b because it models the worst case operation of a precise frequency source. An example of TIE estimation for a double oven controlled crystal oscillator (DOCXO) using the measurement procedure described above is shown in Figure 3. TIE estimation results are obtained as outlined below:
- The initial “sliding” window position (A) for the calculated approximation line is based on frequency counts situated in the fit range.
- Data inside the TIE estimation range is used for determining the time error, TIEA, per Equation 1.
- The calculated TIEA value is shown in Figure 3c.
- The sliding time window is stepped by 1 hour and all calculations are repeated.
- The procedure continues while the TIE estimation range is within the measurement length.
TIE MEASUREMENTS
Even negligible frequency changes influence TIE estimation results. Sources of errors should be taken into account in order to obtain reliable values of TIE. These include mutual synchronization of the frequency of individual oscillators and frequency measurement instability.
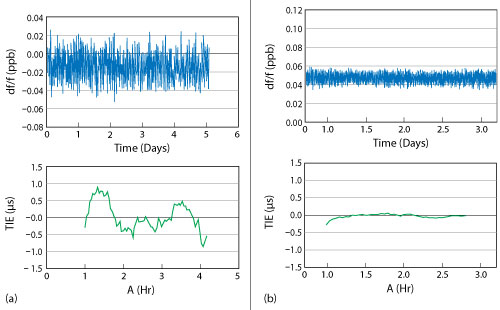
Figure 4 Frequency and TIE estimation for a rubidium oscillator before (a) and after (b) measures to prevent mutual syntonization of frequency.
Mutual Synchronization
Mutual synchronization of oscillators at close frequencies is one of the most important sources of errors for frequency measurement. This effect may be easily seen in volume production when, simultaneously, a large number of oscillators are measured. To prevent this effect, it is necessary to minimize all possible ways oscillators can influence on each other, e.g., on the common grounds of power circuits and circuits of frequency switchers, through electromagnetic coupling and through reverse signal transmission through the open channels of the switcher. As an example, Figure 4 shows the results of rubidium oscillator TIE measurements before and after the implementation of the above measures.
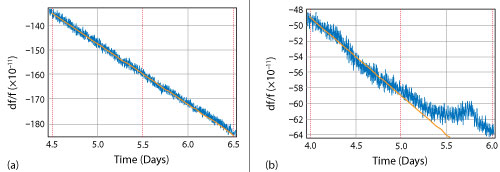
Figure 5 Aging curve meeting the 100…400 ns TIE requirement (a) vs. “standard” aging curve (b).
Frequency Measurement Instability
For precision frequency sources to meet the TIE 100 to 400 ns requirement, it is extremely important to have aging curve monotonicity of about 1 to 2E-11/day. In other words, there should be no jumps or any other irregular frequency changes. Figure 5 compares aging that meets the TIE 100 to 400 ns requirement with one that does not. The reasons for “short-term” frequency changes may be explained by either contact phenomena, stability of the reference source or errors caused by internal issues in the precision frequency source.
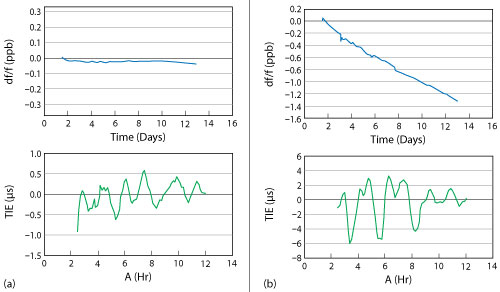
Figure 6 Frequency and TIE for quartz oscillator without (a) and with (b) “short-term” frequency changes.
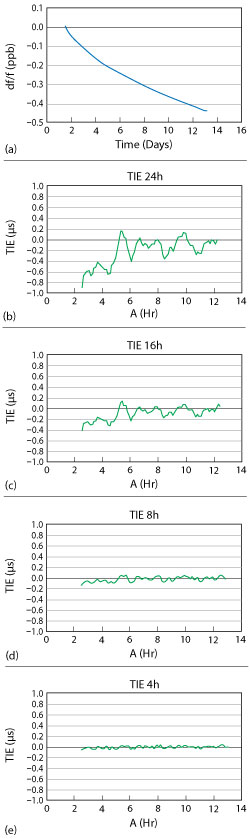
Figure 7 TIE measurements at 24, 16, 8 and 4 hours.
To separate internal issues from the other phenomena, good quality connectors and precision reference sources should be used. During initial measurements we found that some precision rubidium oscillators, regardless of the manufacturer, dramatically changed frequency in increments ranging from 5E-12 to 5E-11. Knowing this, we now use a hydrogen frequency standard for 100 to 400 ns TIE measurements. A TIE measurement for a quartz oscillator with and without “short-term” frequency changes is shown in Figure 6.
TIE measurements will be reliable if all factors listed above are taken into account. Examples of TIE measurements over 4, 8, 16 and 24 hours are shown in Figure 7.
References
- H. Li, L. Han, R. Duan and G. M. Garner, “Synchronization Requirements of 5G and Corresponding Solutions,” IEEE Communications Standards Magazine, Vol. 1, No. 1, March 2017, pp. 52–58.
- “NR; Base Station (BS) Radio Transmission and Reception,” 3GPP TS 38.104 specification, 3GPP Portal.