
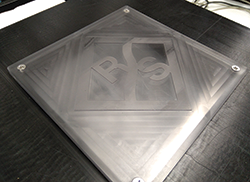
Figure 6 Demonstration radome where the logo is 0.5 mm thicker than the radome material, causing an impedance mismatch at 77 GHz.
To illustrate the approach, a radome was manufactured where the R&S logo was milled with different thickness, as shown in Figure 6. The high resolution radar image in Figure 7a visualizes what an automotive radar sensor would perceive when covered by this radome. The color scale shows the reflectivity, where the dark color indicates minimal reflectivity and bright high reflectivity. Metal, which cannot be penetrated by automotive radar signals, appears as white (e.g., the screws in the four corners). The radome image indicates high reflectivity and the inhomogeneity of the logo, showing the increased thickness of 0.5 mm in the logo area is sufficient to cause major disturbances in radar performance on the street. In this example, calculating the mean reflectivity in the middle area, where the radar sensor is usually mounted, yields approximately ‐11 dB with a standard deviation of ‐17.7 dB. In many practical cases, this reflection is too high to maintain acceptable radar operation. In practice, the expected reflectivity depends on the sensitivity of the radar and the maximum detection distance to be covered.
Transmission
In a second test, the frequency matching and attenuation of the radome material is measured. A transmitter module is located behind the radome on the table. The transmitter uses a frequency sweep to cover a selected frequency span. This allows the radome’s transmission frequency response to be measured. The frequency response delivers detailed information about the RF matching of the radome at the frequencies intended for radar operation. It is independent of the signal waveform used by the radar, which facilitates the testability and optimization of the radome itself.
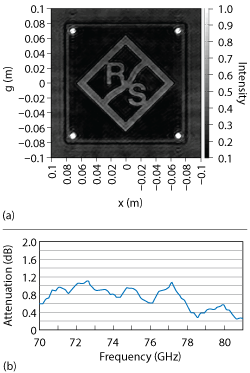
Figure 7 High-resolution mmWave image (a) and one-way attenuation (b) of the demonstration radome.
The measured one-way attenuation versus frequency of the radome is shown in Figure 7b. Since automotive radars operate in the 76 to 81 GHz band, attenuation should be low across this range. Depending on the thickness of the material, its air gaps and RF matching, a good radome should maintain low attenuation across the desired frequencies. The logo example shows 0.64 dB one-way attenuation with better matching at 79 than at 76 GHz. A more sophisticated example for commercial radomes with a 3D design typically results in a transmission measurement, as shown in Figure 8. This radome would have various performance issues:
- Frequency matching is incorrectly placed around 71 instead of 76 GHz, which is often caused by increased thickness of some radome layers
- Significant increase in the standing wave ratio within the 79 GHz band, which identifies high reflections at the radome boundaries and a strong interference phenomenon
- Overall one-way attenuation is relatively high, which results in a significant reduction in the detection range.
SUMMARY
Researchers are already driving autonomous cars on the highway and in city traffic. Due to the all-weather capability of radar sensors, their reliability and their price, these sensors are essential in automotive applications. Integration behind bumpers and emblems also makes them attractive for car designers. Without high-quality radomes, objects with low radar cross-sections, such as pedestrians, will likely be undetected and may even appear at erroneous azimuth angles. Even larger objects at far distances may be incorrectly identified and measured at different positions when the radar signal is distorted by the inhomogeneous radome material.
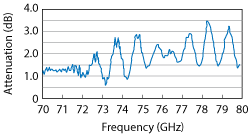
Figure 8 Transmission measurement of a commercial, multi-layer radome with a complex 3D design.
This article presented a novel measurement method that can be applied for any kind of automotive radome operating in the 75 to 82 GHz band, such as the ones used in emblems, bumpers or front grills that cover automotive radar sensors. Using a massive multistatic array, within a few seconds this method measures and calculates the mean reflectivity and standard deviation of a defined area (homogeneity) and the transmission loss over the complete frequency range. The visualization of the results as an image assists radome designers and R&D labs, while determining a pass/fail result based on the radome’s RF performance significantly speeds production, especially at end-of-line testing.
Watch a video demo of the Rohde & Schwarz QAR system at http://videos.microwavejournal.com/video/Automotive-Radar-Radome-Chara-2