
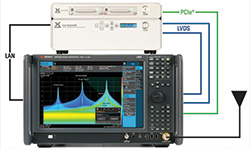
Figure 1 Integrated solution to support wideband RF streaming and analysis.
On an electronic battlefield, the frequency spectrum is crowded, chaotic and complex. If a digital RF memory (DRFM) system misidentifies an unfriendly RF emitter, it may respond with an inappropriate jamming signal. If a radar-warning receiver (RWR) fails to identify an emitter, the consequences can be dire.
The ability to fully understand system performance in a real-world signal environment is crucial to the design and validation of the latest radar and electronic warfare (EW) systems. Characterization of these systems can be a daunting task due to the many operating modes they employ. For each mode, it’s often necessary to validate pulse widths, pulse-repetition intervals, modulation formats, frequency agility and many other signal parameters. It’s also important to understand timing relationships, especially when dealing with threat-response interactions.
There are two key measurement challenges. First, it is necessary to capture 100 percent of the RF energy output during a test that includes highly unpredictable signals-of-interest. Second, the resulting mountain of data must be analyzed and interpreted.
Fortunately, the latest digitizers and digital interfaces enable the creation of RF streaming solutions that can capture gap-free data for seconds, minutes or even days, ensuring that no signal is missed. Post-processing software tools make data reduction and analysis more manageable, accelerating the time-to-answers by uncovering signal anomalies, pulse-timing relationships and more (see Figure 1). This integrated combination of commercial, off-the-shelf hardware and software supports wideband RF streaming and analysis. It includes an IQC5255B recorder (top) and Spectro-X signal analysis software from X-COM Systems as well as a UXA signal analyzer (bottom) and 89600 VSA software from Keysight Technologies.
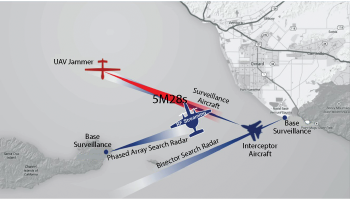
Figure 2 RF streaming system captures gap free I/Q data from four emitters.
Understanding the Recording Scenario
To ensure accurate capture of the signal environment, it is necessary to consider the real-world setting in which recording occurs. These may include mobile or fixed-site scenarios, onsite operation or remote control, and manual or automated data collection.
Figure 2 provides an example. A streaming solution onboard a surveillance aircraft is tasked with recording the RF interaction between the interceptor aircraft and an unmanned aerial vehicle (UAV) jammer. The system also captures signatures from two surveillance radars, enabling analysis of their effects on interceptor/jammer interaction.
Defining Streaming Requirements
In any RF recording system, the main performance considerations are RF frequency range, real-time analysis bandwidth, spurious-free dynamic range (SFDR) of the receiver, IF amplitude flatness, IF phase linearity and maximum recording time. To fully capture signals, the solution must provide sufficient phase-continuous I/Q bandwidth; it is very difficult to extract pulse-descriptor words (PDW) if a wideband signal straddles one or more measurement channels.
Better SFDR represents improved receiver sensitivity and ensures the system’s ability to record the actual RF environment, even with small signals hiding adjacent to larger ones. Flatness of the amplitude or phase response across the analysis bandwidth impacts modulation quality, with inaccuracies causing high error vector magnitude (EVM) in communication signals or significant phase errors in chirped radar signals.
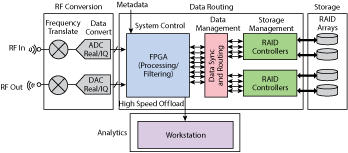
Figure 3 Signal flows inside an RF streaming solution.
In addition to RF performance, it is useful to consider the recording capabilities of the system. Attaching metadata to the recording enables association of precise time stamps and geo-data with specific RF events, simplifying post-processing by allowing analysts to fast-forward through the data set and quickly find points of interest. The configuration of the recording system can also be included to document items such as instrument settings and software or firmware version numbers. This helps users to compare data and understand discrepancies in data collected at different times.
Generating and Handling Massive Data Sets
This is a “big data” process; streaming an I/Q signal with 100 MHz of bandwidth at 16-bit resolution for 10 minutes will produce 300 GB of data. At 255 MHz bandwidth, or 300 MSa/s, every second consumes 1.2 GB of storage space. To sustain the necessary gap-free recordings at these rates, every component in the data-processing chain must be able to keep up. Figure 3 shows a high-level view of signal flows inside an RF streaming solution. Individual data streams are directed to separate drives in a redundant array of independent disks (RAID).
The key element is an FPGA that controls the system and configures it for recording or playback. It manages the routing of I/Q samples and provides deterministic association of metadata with I/Q data.
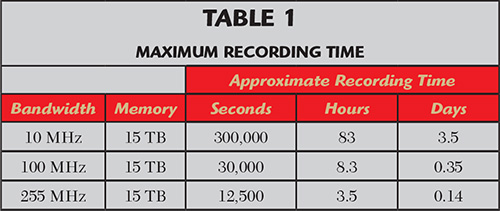
Referring back to the system in Figure 1, the recorder can be configured with 2 or 4 TB of onboard memory or, optionally, 15 TB in the form of an external RAID array. At 15 TB, the recorder can capture more than three hours of data at a full bandwidth of 255 MHz. Table 1 provides approximate recording times based on the bandwidth setting of the signal analyzer.
The relationship between bandwidth, memory and time can be expressed using the following equation:

Where the value 1.25 is an approximate span-to-sample rate conversion factor.
Capturing Real World Scenarios
When the environment contains numerous emitters of varying amplitudes, it can be difficult to find low level signals in the presence of much larger ones. In the streaming solution described above, the signal analyzer provides 78 dBc of SFDR across the full 50 GHz frequency range, and this is recorded with the high-resolution 16-bit I and Q capture capability of the recorder to produce deeper views of signal behavior.
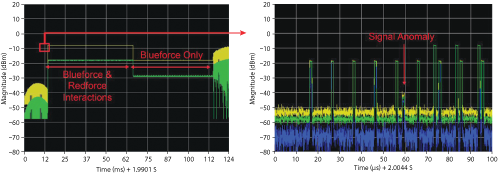
Figure 4 Successive zooming in the time domain to reveal signal details down to the sample level.
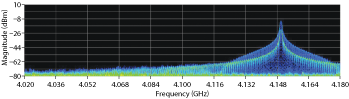
Figure 5 Persistence density plot of emitter/jammer interaction.
Seamless integration between the signal analyzer and recorder makes it possible to configure and initiate recording directly from the analyzer’s front panel, streamlining recording control and eliminating the need for an external PC or laptop. An added benefit is the ability to simultaneously view the live spectrum measurements on the analyzer screen while a recording is in progress.
Converting Data into Information
After data collection is complete, users have many questions: What happened on mission day? Is the data good? Did the system under test perform as expected? Were there any RF anomalies or unexpected emitters?
Advanced signal processing tools turn raw data into useful information and actionable results. For example, the ability to search through large sets of data and isolate specific signal behavior is essential to helping a system engineer or signal analyst determine whether the system performed as expected or if there were any timing anomalies or unexpected RF emitters.
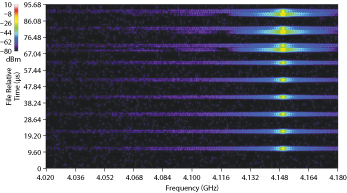
Figure 6 Spectrogram displays time on the y-axis, frequency on the x-axis and amplitude via a color scale.
These capabilities can be implemented in signal analysis software that provides the ability to quickly zoom in on desired recording segments using automated signal- and pulse-search algorithms. Functions that range from basic frequency, time or amplitude filtering to highly advanced pulse pruning based on pulse width, pulse repetition interval (PRI) and more, make it easy to search through vast sets of data and uncover rare events or signals. For example, zooming in on interceptor/jammer interaction in the time domain makes it easy to see the relative timing of pulses as shown in Figure 4. It may also reveal signal anomalies such as the one that appears after the fifth blue pulse in the trace on the right.
Once a time segment has been identified for study, the interaction can be replayed as both frequency and spectrogram displays for visual inspection. Displays such as the persistence density plot of emitter/jammer interaction (see Figure 5) help reveal signal behavior in the frequency domain. A spectrogram (see Figure 6) makes it easier to understand dynamic signal behavior in multiple dimensions by displaying time on the y-axis, frequency on the x-axis and amplitude via color scale. The anomaly is visible at multiple times in the spectrogram plot.
After the analyst has located a signal or event of interest, it can be quickly exported to the vector signal analysis software for deeper analysis. This is as simple as snipping out a section of the recording by drawing a rectangle around the emitters of interest. With optional pulse-analysis capabilities, the VSA software can be used to tabulate pulse parameters, measure modulation quality, compute PDWs and evaluate timing relationships (see Figure 7).
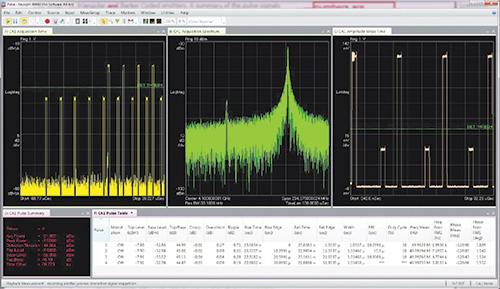
Figure 7 VSA software simplifies in-depth pulse analysis through automatic synchronization to pulsed signals and auto-detection of modulation on a pulse.
Features such as frequency-mask and time-qualified triggers can pinpoint issues down to a single pulse within thousands, and automatic detection of modulation per pulse enables faster, easier analysis of pulse characteristics. Extensive, flexible displays and markers enable viewing of virtually every facet of a signal, giving valuable insight into signal behavior.
Conclusion
In a crowded, chaotic and complex signal environment, high-performance RF streaming provides a record of what happened over long periods of time. An integrated combination of measurement performance and analysis capabilities help users accelerate time-to-answers as they push the envelope in next-generation radar and EW systems.