
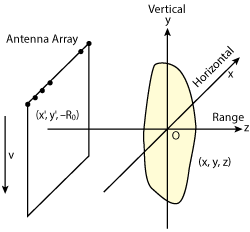
Figure 1 Holographic imaging system configuration.
A W-Band active three-dimensional (3D) prototype imaging system for personal security inspection has a one square meter scanning area and demonstrates a cross-range resolution better than 0.5 cm.
Millimeter wave imaging techniques are often used for the detection of concealed weapons and contraband. Millimeter waves can penetrate clothing1 and image hidden items with high resolution. Unlike X-rays, millimeter waves are non-ionizing and, thus, more suitable for human body security screening.2 Millimeter wave imaging systems may be active or passive. Passive systems utilizing compact structures to identify temperature contrast are capable of performing real-time 2D imaging but can’t easily detect dangerous items on the human body in an indoor environment.3 They are also unable to produce 3D images.4 Active systems allow the formation of a fully focused 3D image from data gathered over a 2D aperture optically or by using a Fourier transform.5 Existing active imaging systems operate mainly in Ka-Band, driven by technology and cost. This limits their resolution. Terahertz technology offers the potential for high resolution and is a growing area of research, but the availability of stable sources and detectors at acceptable costs is a key limitation. In W-Band, on the other hand, good atmospheric absorption characteristics, short wavelengths and the ability to generate wide bandwidth signals offer the potential for high resolution without having to pay a considerable price.
This article describes an active, broadband 3D imaging system operating in W-Band for personal security inspection. The prototype with a 1 × 1 m scan area and 3D wave number domain imaging algorithm6 is used to image specific items such as a small metal ball, knife and transportation card.
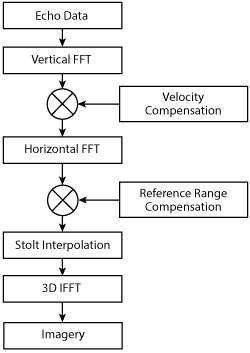
Figure 2 3D planar aperture algorithm.
Figure 3 Imaging system functional blocks.
Imaging Algorithms
3D planar scan imaging is derived from holographic imaging based on the Fourier transform. The antenna continuously scans vertically and horizontally over the 2D scan plane to obtain a high quality image, while signal bandwidth is used to obtain range (see Figure 1). A simplified diagram for a 3D active planar imaging system is shown in Figure 2. Data collection is performed by scanning a transmitting source and receiver over a rectilinear aperture that has targets within its field. Target locations and scattering coefficients are obtained after mixing with a transmitter reference signal carrying the system delay and filtering.7 Vertical and horizontal fast Fourier transforms (FFT) are performed and then compensated for the phase residual caused by antenna velocity and reference range. After 2D Stolt interpolation and 3D inverse Fourier transforms, we obtain target scattering coefficients and imaging.
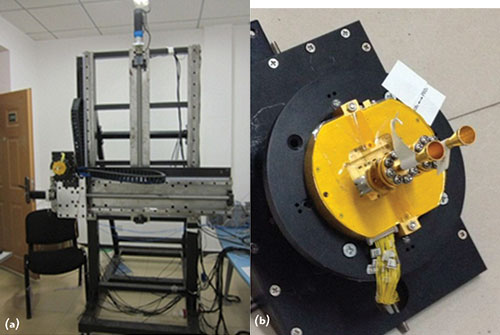
Figure 4 Scanning platform (a) and W-Band detector (b).
To ensure target integrity and accuracy, the Nyquist sampling theorem must be considered during the planar 3D imaging process:
Figure 5 W-Band detector block diagram.
Figure 6 Cuboid model of eight scattering points.
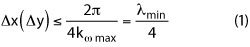
where Δx and Δy represent the biggest vertical and horizontal sampling intervals, respectively, λmin denotes the shortest frequency wavelength and kω indicates the wave number.
To avoid range ambiguity, the corresponding time domain sampling rate should satisfy
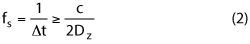
where Dz is the targets’ maximum diameter in the range domain.
The system’s working frequency spans from 90 to 94 GHz with a 4 GHz bandwidth. The system can theoretically realize a 3D resolution of
Figure 7 Reconstructed image in cross-range plane.
where θ is the antenna beamwidth.
Imaging System
The W-Band imaging system includes an RF front-end module, data acquisition module, 2D mechanical scanning platform, processing module and a terminal user interface (UI), shown in Figure 3. The millimeter wave signal is generated using an oscillator, then transmitted and received with a small 19 degree beamwidth conical horn antenna. The data acquisition and data processing modules act on the signal and develop the image. The UI shows the results.
The W-Band antenna and detector are installed on a platform (see Figure 4). The scanning driver controls the antenna to continuously scan a 2D plane while counting the step size for the servo motor. In accordance with the sampling interval, a trigger controls the antenna send-and-receive synchronizing signal for data acquisition. The source is connected to the receiver with a phase-stable cable, ensuring stability of the local oscillator signal during mechanical scanning. The workstation reads and processes the stored 3D data gathered by the transceiver and reconstructs the 3D image.
Figure 8 3D image in Cartesian coordinate system.
A block diagram of the detector is shown in Figure 5. A direct digital synthesizer (DDS) generates a 500 MHz wide linear FM chirp. Mixing it with signals from the two phase-locked oscillators generates mid frequencies of 10.3 GHz and 10.285 GHz. After filtering and 8× frequency multiplication, two 4 GHz bandwidth linear FM signals are obtained. The 90 to 94 GHz signal is used for transmit, while the 89.88 to 93.88 GHz signal is the reference for down-conversion to an intermediate frequency of 120 MHz. Following A/D conversion, the imaging data is sent to the workstation for storage and processing.
SIMULATED AND MEASURED RESULTS
To verify the effectiveness of the theoretical analysis, a simulation was performed using eight ideal points. The system working frequency ranges from 90 to 94 GHz with a scan rate of 1 m/s. The reference distance, Ro, is 1.5 m. The simulation cuboid model (shown in Figure 6) has a spacing between points of 0.1 m. It assumes that the radar scattering cross section (RCS) of all scattering points is 1 m2 and uses the wave number domain imaging algorithm to image them in the cross-range plane (2D image) and Cartesian coordinate system (3D image). As shown in Figures 7 and 8, the scattering points are located at the dotted line intersection. The imaging results in three directions is clear, with a 30 dB dynamic range and each single scattering point’s sidelobe feature close to a sinc function. The image is a little out of focus due to velocity effect errors, and the range resolution can be improved by widening the signal bandwidth.
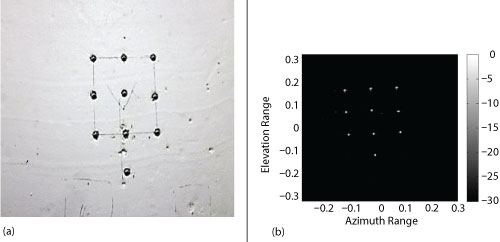
Figure 9 Optical (a) and W-Band (b) images of metal balls.
Test results from a 90 GHz proof-of-principle prototype built with a 1 × 1 m scanning area. are shown in Figures 9 through 12. Figure 9 compares the images of 10, 1 cm radius metal balls embedded in a foam plate. Target location features, such as spacing, ball position and slant angle are clearly identified. The cross-range resolution of the ball with strongest RCS is approximately Δx = 0.36 cm, Δy = 0.48 cm, respectively (see Figure 10). Due to the features of a volumetric object versus an ideal point, this is estimated. Figure 10 shows the radius of the ball leads to a mismatch of the mainlobe and sidelobe. This may be due to a phenomenon similar to mainlobe splitting.
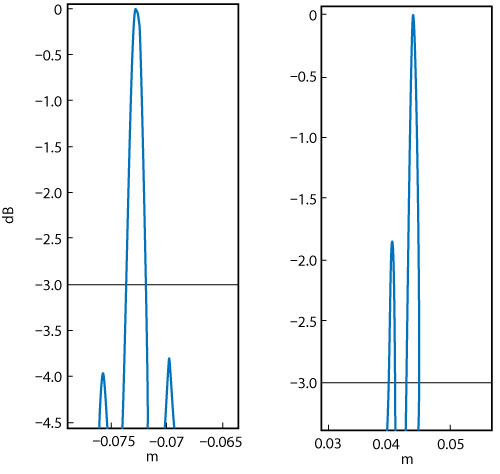
Figure 10 Metal ball return on x-y cross-range plane.
Different objects, including scissors, a knife and a transportation card were also tested. In Figure 11, for example, a tiny structure between the blade and corkscrew of the knife is easily seen, and the image is clear enough to differentiate the knife and scissors. Figure 12 shows that the system can penetrate the plastic cover of a transportation card and image its chip in the top right corner, demonstrating that the system has penetrability. With planar imaging precision, the strip on the card is also discerned, which highlights the system’s capability to identify plastics as well as metal items.
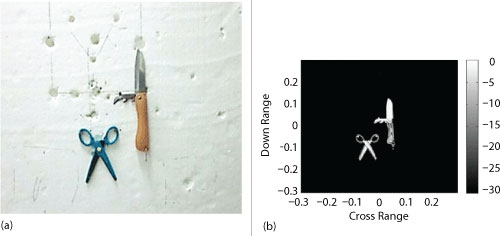
Figure 11 Optical (a) and W-Band (b) images of scissors and knife.
Conclusion
A prototype W-Band imaging system for security inspection provides large angle illumination of a target in the near field with a broadband frequency sweep. After compensating for channel error, high quality images of several different targets have been generated by the system. Test results prove its feasibility for obtaining detailed and accurate images of small carry-on objects such as a plastic transportation card, a folding knife and scissors.
Figure 12 Optical (a) and W-Band (b) images of transportation card.
References
- H.D. Collins, D.L. McMakin, T.E. Hall and R.P. Gribble, “Real-Time Holographic Surveillance System,” U.S. Patent 5,455,590, issued 14 March 1994.
- C. Zech, A. Hülsmann, I. Kallfass, A. Tessmann, M. Zink, M. Schlechtweg, A. Leuther and O. Ambacheret, “Active Millimeter-Wave Imaging System for Material Analysis and Object Detection,” International Society for Optics and Photonics, Vol. 8188, September 2011.
- J. Abril J, E. Nova, A. Broquetas, F. Torres, J. Romeu and L. Jofre, “Combined Passive and Active Millimeter-Wave Imaging System for Concealed Objects Detection,” 35th International Conference on Infrared Millimeter and Terahertz Waves, September 2010, pp. 122.
- D.M. Sheen, D.L. McMakin and T.E. Hall, “Three-Dimensional Millimeter-Wave Imaging for Concealed Weapon Detection,” IEEE Transactions on Microwave Theory and Techniques, Vol. 49, No. 9, September 2001, pp. 158121592.
- N. Osumi and K. Ueno, “Microwave Holographic Imaging Method With Improved Resolution,” IEEE Transactions on Antennas and Propagation, Vol. 32, No. 10, October 1984, pp. 101821026.
- R.A. Bamler, “A Comparison of Range-Doppler and Wavenumber Domain SAR Focusing Algorithms,” IEEE Transactions on Geoscience and Remote Sensing, Vol. 30, No. 4, July 1992, pp. 7062713.
- M.C. Kemp, “Millimetre Wave and Terahertz Technology for the Detection of Concealed Threats: a Review,” 15th International Conference on Terahertz Electronics, September 2007, pp. 6472648.