
Every engineer responsible for a test system is also responsible for the accuracy and repeatability of the measurements it makes. Repeatability, perhaps more than pure accuracy, is often the key to success in design, manufacturing and ongoing operations. In a test system, repeatability is also the foundation of the warranted performance of the included instruments. This is especially true for crucial equipment such as network analyzers, signal analyzers, power meters, oscilloscopes and signal generators. If any specified parameter is out of tolerance, measurement results can be negatively affected.
An accurate, professional and accredited calibration is the bedrock that ensures reliable and repeatable results. Calibration and metrology are a specialized subset of engineering, and relatively few engineers have been trained in these topics. Fortunately, developing familiarity with a few fundamental concepts will improve measurement performance, enhance the interpretation of results and, ultimately, reduce the risks associated with every decision that is based on measured results.
Meeting Measurement Requirements
A test system supports a test plan, and the essential first step is to identify the crucial specifications that characterize the performance of the device under test (DUT). Each specification will have an associated set of tests, tolerances and accuracy requirements. The development of the test plan includes the selection of hardware elements that provide the necessary features and functions. For an engineer, the natural response is to thoroughly understand the choices and tradeoffs in the various hardware alternatives.
Figure 1 Knowing the nominal performance of DANL and TOI helps to optimize spur searches.
Typically, less time is spent considering the calibration and repair services needed to sustain the warranted specifications of each instrument. It’s easy to assume that periodic calibration is all that’s needed to ensure measurement integrity over the long term. In reality, test equipment ages and drifts, and sometimes it breaks. What’s more, calibration is not a generic commodity, and the process of ensuring long-term measurement repeatability is not as simple as “set it and forget it.” Taking a proactive stance can have a significant impact on the ongoing accuracy and repeatability of the test system, not only reducing the risk of out-of-tolerance measurements, but actually improving the system’s effective accuracy. This can help ensure the performance of the DUT and enhance overall productivity in manufacturing.
Using Calibration to Improve Spurious Measurements
An example focused on the pursuit of spurious signals using a signal analyzer will show how to ensure greater confidence in results. This is an illustration rather than a tutorial on spur detection. Unwanted spurious signals are present in all types of radio frequency (RF) and microwave applications, such as wireless communications, radar and electronic warfare (EW). Many spurs come from the increasingly crowded spectral environment and, depending on the situation, may be expected or unexpected. Other spurious signals may occur within the DUT. This is especially problematic in devices that contain multiple transmitters with close physical spacing. The smaller the distance between any two transmitters, the greater the likelihood and magnitude of interference. Some measured spurs may be generated inside the spectrum or signal analyzer itself. These may be understood to the extent that themanufacturer can program the analyzer to reduce the effect on measurement results.
Collectively, spurs are the source of many potential problems. In a radar system, spurs may obscure the system’s ability to see small return signals, which can affect the believability of what’s on the screen. For those performing sensitive field operations, self-generated spurs emanating from a receiving antenna may betray their presence and location. Thus, when making a measurement, the key question is when a spur appears,is it real?
A spur search is usually a matter of finding small signals in the presence of much larger ones. Thus, the key specifications are spurious-free dynamic range and sensitivity. Because the frequencies of spurious signals are generally not known in advance, the process starts with a wideband spectrum measurement. The best setting for input attenuation depends on the magnitude of the largest signal in the widest span. With this combination of wide span and the likely presence of larger signals, many low-level signals will be missed due to insufficient frequency resolution and a higher-than-desired effective noise floor. To increase the available dynamic range, input attenuation should be minimized while remaining sufficient to prevent analyzer-generated signals, such as harmonics and intermodulation, from interfering with the measurement. The resolution bandwidth (RBW) should be just narrow enough to reduce the effective analyzer noise floor and resolve closely spaced spurs while providing sufficient measurement speed.
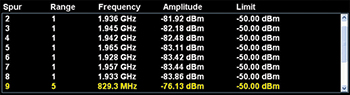
Figure 2 A spurious signals measurement application provides the spur results for a DUT.
A useful example is the verification of spurious-free dynamic range (SFDR) in a radar exciter. The carrier fundamental is at 10 GHz. The exciter’s SFDR must be 80 dB below the carrier (-80 dBc), and this equates to -65 dBm relative to anexciter with a +15 dBm output level. These are the key specs for the DUT. Characterizing those parameters depends on the signal analyzer’s dynamic range, and that depends on specifications related to noise and spurs. Suppose a signal analyzer has a specified displayed average noise level (DANL) of -148 dBm. Because DANL is typically normalized to a 1 Hz RBW, the actual specification is -108 dBm when using a 10 kHz RBW. Residual responses are specified to have a level of -100 dBm or less. Related to this, third-order intermodulation (TOI) is specified to be -90 dBm. Understanding the trade-off between expected DANL (not a hard specification) and TOI is important when setting input attenuation and mixer level for a spurious measurement (see Figure 1). Beyond the generic specifications, it would also be helpful to know the actual performance of an individual analyzer. Is it below spec, at spec or better than spec? If better than spec, how much better is it? This information is essential to enhancing the ability to interpret the actual measurement results from the analyzer.
Back to the fundamental question, when I see a spur, is it real? This is easier to answer with the addition of information that improves the effective performance of the measurements. For example, calibration results can be applied and then used to improve measurement performance and speed. Figure 2 shows the output of a spurious signal measurement application built into a signal analyzer. Its tabular output shows spur number, measurement range, spur frequency, spur amplitude and the user-entered measurement limits.
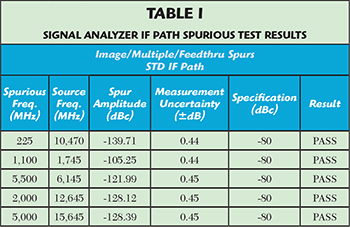
Comparing the DUT results with actual calibration data for the signal analyzer makes it possible to apply in-hand knowledge and thereby adjust measurement settings to ensure greater confidence in results. Table 1 shows the measurement data from the calibration of a high performance signal analyzer. The worst-case spur is at 1.1 GHz with a level of -105.25 dBc. From this, the attenuation and RBW settings can be adjusted to achieve a lower noise floor and provide greater certainty that any displayed signals are real.
Using Calibration Data to Improve Performance
It’s reasonable to expect that a full calibration will test and verify all warranted specifications for all possible configurations of an instrument. Unfortunately, not every provider of calibration services is quite so thorough. It can certainly be a challenging task. For example, the calibration of one typical midrange signal analyzer requires 36 individual tests to ensure the instrument is performing as expected. After performing all these tests, the lab should provide a full measurement report along with traceability to (and compliance with) recognized calibration standards. Verification of testing, test results and standards compliance is essential to knowing the analyzer is meeting its warranted specifications. Figure 3 shows an example of a calibration report that can be used to improve measurement performance. The table contains the measured frequency response of a signal analyzer, including measurement uncertainty and the applicable instrument specifications. This data can be used to achieve tighter DUT specifications, wider manufacturing margins, faster test throughput or improved yield. In R&D, this data can help optimize designs and avoid the need to reconcile inconsistent results from different teams.
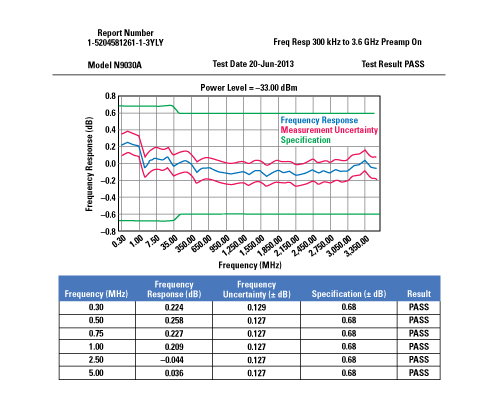
Figure 3 Calibration data for an instrument can assist with the interpretation of measurement results.
Although a single engineer is often responsible for ensuring measurement performance, he or she is typically not the only person involved in obtaining calibration services. A few suggestions can ensure companies are getting what they need, while avoiding situations that undermine the ability to achieve the expected levels of instrument performance. First, it is important to be explicitly clear about expectations for calibration. This means specifying which warranted performance parameters must be verified every time the instrument is calibrated. It’s also important to ensure others understand the limits of “performance verification.” Even with adjustments, it isn’t the same as an actual calibration. Instead, it’s better to request that every warranted specification for every installed option be checked every time. For additional assurance, it’s best to verify that the following is always included:
- Audit calibration reports
- Full test results
- List of all calibration equipment and verification that it has been tested
- Confirmation that the calibration meets traceability requirements.
As a final suggestion, it can be worthwhile to determine the economic value of this “insurance.” For example, the ability to meet or exceed a target yield rate can reduce the number of DUTs that are scrapped or sent back for rework. This type of information can be an effective way to help management and procurement personnel appreciate the value of high quality calibration.
Conclusion
Opting for the most dependable calibration provider is the best way to ensure that test equipment continues to provide the performance that led to the purchase decision. In a commercial setting, this often translates into better throughput, margin and yield. In the aerospace and defense environment, it increases the likelihood of mission success. In any setting, reliable calibration ensures consistent results that make it easier to pinpoint product or design problems thereby minimizing delays in development and manufacturing.