
This article describes a method of performing RF power measurements on ZigBee devices in the field using a portable spectrum analyzer. Because a portable spectrum analyzer is too slow for displaying the whole ZigBee spectrum instantaneously, it is accumulated over time using the analyzer’s Max Hold feature. Spectrum analyzer settings are derived that produce measurement results accurate to within 1 dB.
The most common and accurate way to measure RF power is to use a power meter; however, traditional power meters measure average power and therefore cannot be used for the measurement of packet-based waveforms (like ZigBee). For this application, a spectrum analyzer can be used. A spectrum analyzer, which measures channel power by capturing a waveform’s spectrum, is appropriate for any type (pulsed or non-pulsed) waveform. It should be fast enough to capture the entire spectrum during each burst. A fast measurement instrument, however, is expensive and impractical when power has to be measured in the field (i.e., outside the lab environment).
Handheld spectrum analyzers (used for field measurements) are usually much slower than lab analyzers. For example, the Anritsu S332E Site Master handheld analyzer has a sweep speed of 1 ms per data point,1 while the high-end Rohde & Schwarz FSU laboratory spectrum analyzer is capable of doing 80 measurements per second.2 A consequence of the Anritsu’s slower speed is that only a portion of the entire spectrum (600 kHz of the occupied channel bandwidth of 5 MHz) is shown at one time on the spectrum analyzer display. Since channel power is calculated based on the displayed spectrum, a method of displaying the whole spectrum of a pulsed signal on the analyzer’s screen is needed.
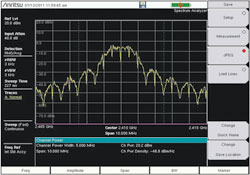
Figure 1 ZigBee spectrum.
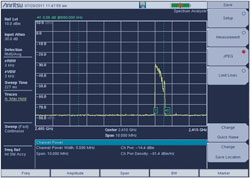
Figure 2 ZigBee spectrum displayed by a portable spectrum analyzer.
Accumulation of Displayed Spectrum
ZigBee radio transmits over short intervals: 1.7 ms every 30 seconds or so. During each burst, one expects to observe the whole ZigBee spectrum, as shown in Figure 1. When measured with Anritsu’s S332E, however, the typical spectrum presentation of a ZigBee module’s output in the operational mode is shown in Figure 2. This is because its fastest sweep is more than 200 ms, while the length of a typical ZigBee burst is about 2 ms. These bursts are interpreted by the S322E to be a periodic pulse train, represented as a Fourier series by3
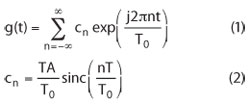
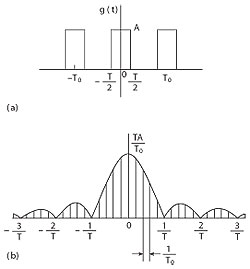
Figure 3 Fourier conversion of a periodic function – time domain waveform (a), discrete spectrum (b).
This is shown graphically in Figure 3, where Figure 3(a) is the time domain representation (Equation 1) and Figure 3(b) is the discrete spectrum amplitude due to the SINC function (Equation 2). Its value is displayed between each of the vertical lines representing conversion from consecutive pulses. If for some reason the pulse train is stopped (or not seen by the spectrum analyzer), the spectral display is also stopped. This occurs when the time it takes for the analyzer to display the spectrum prevents it from catching the next packet in the pulse train. If, after capturing the first two packets, it loses the rest of the train and has to start anew, then it is displayed as bursts (see Figure 2). Because pulse train acquisitions occur at random times, the bursts appear at random starting frequencies and eventually cover the whole ZigBee spectrum, as in Figure 1. In order to preserve them and accumulate the whole spectrum to obtain a correct measure of channel power, the “Max Hold” trace feature of the S332E is used.
Spectrum Analyzer Settings
Channel power readings depend on the spectrum analyzer settings, including detector type, sweep mode, resolution bandwidth (RBW) and video bandwidth (VBW). These are inter-dependant, so some are chosen as initial settings. Detector type and sweep mode are initial settings. The detector setting is RMS/Avg, because the averaging detector is used specifically for channel power measurements, integrating amplitudes over frequency intervals. Sweep mode is set to “Fast” to allow sufficient time for data capture, enabling good amplitude accuracy and excellent frequency accuracy.
With these initial settings, values for RBW and VBW are derived. The easiest approach is to compare the spectrum analyzer’s readings with very accurate readings from an averaging power meter. The power meter, however, does not provide accurate readings for pulsed waveforms. What can be used, in this case, is a special mode of a ZigBee modules’ operation designed for regulatory compliance tests. In this mode, the module is not switching between transmit and receive branches, but transmits the ZigBee waveform without intervals, i.e., continuously. The power meter directly reads the waveform’s average power and the spectrum analyzer displays the entire ZigBee spectrum. This provides corresponding power readings to calibrate the spectrum analyzer.
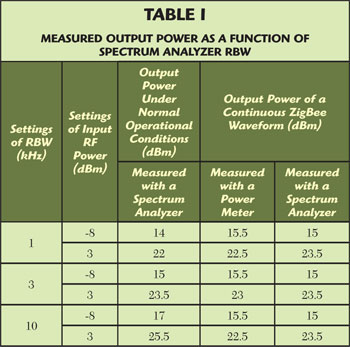
To determine the correct RBW and VBW settings, the value of RBW is varied (while the VBW is kept in AUTO). Spectrum analyzer readings of channel power for 500 packets are compared with spectrum analyzer readings of channel power for the continuous ZigBee waveform. These, in turn, are compared with power meter readings (on the same continuous waveform). Results are given in Table 1, showing that all three readings coincide (within the accuracy of the measurements) at 3 kHz RBW.
Conclusion
An accurate method of measuring RF power on ZigBee devices in the field is described. A compact handheld spectrum analyzer from Anritsu (model S332E) is used as an instrument to measure channel power. Because the S332E is too slow for displaying the whole ZigBee spectrum instantaneously, the MAX Hold trace feature is used.
To determine the correct spectrum analyzer settings, RF power measurements with a power meter are performed on a continuous ZigBee waveform and are compared to measurements made using the S322E. To set the RBW, spectrum analyzer power measurements under normal operating conditions are compared to those made on the continuous waveform. With the correct spectrum analyzer settings, all three methods of measurements coincide within the accuracy of the readings (±0.5 dB).
References
- Anritsu Technical Data Sheet S332E Site MasterTM Compact Handheld Cable & Antenna Analyzer with Spectrum Analyzer, www.anritsu.com/en-US/Products-Solutions/Products/S332E.aspx.
- R&S®FSU Spectrum Analyzer High-end Spectrum Analysis Product Brochure, www.rohde-schwarz.com/en/product/fsu-productstartpage_63493-7993.html.
- S. Haykin, Communication Systems,Second Edition, John Wiley & Sons, 1983.