
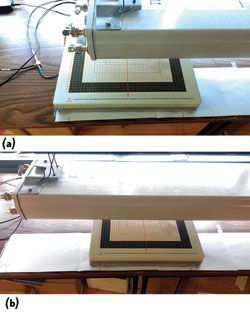
Figure 1 Very-near-field array in the first position (a) and in the next position (b).
Far-field characterization of antennas that are both electrically and physically large can be a challenging task since the far-field region of these antennas can be quite long. A good example of this is a base station antenna at 700 MHz. The rule of thumb for the boundary of the far-field region in this situation is
d = 2D2/λ (1)
where D is the largest dimension of the antenna and λ is the free space wavelength. A base station antenna might be 1.2 m long and at 700 MHz, the free space wavelength is 0.42 m. Hence, the far-field region for such an antenna begins approximately 13.6 m from the antenna. This means specialized test sites would likely be required.1,2 These test facilities can have long lead times to schedule testing. On top of this, many base station antennas have mechanical tuning that requires multiple measurements. Characterization of these antennas in the far-field region can be time consuming and very costly.
There is an alternative to direct far-field measurement, which is based on very-near-field measurement. The very-near-field measurement approach has already been successfully commercialized for small antennas.3 The implementation of this method is based on an array of small magnetic field probes which sample the fields in the very-near-field region of the antenna. Algorithms can then transform these measurements to far-field data in a matter of seconds. Theoretically, this method can be scaled to arbitrarily large antennas. However, increasing the size of the array of probes has serious practical limitations.
To overcome these limitations, a method has been developed to combine multiple very-near-field measurements to form a larger synthetic measurement area. This method will divide the desired very-near-field region into tiles, each the same size as the array of probes. The measurement array will sequentially measure the fields in each of these tiles. If the resulting very-near-field tiles are properly combined together like puzzle pieces, the transformation to the far-field will provide accurate results for the entire synthetic measurement area.
This article will show sample results for what is called the multi co-planar approach. This approach combines multiple planar very-near-field tiles and provides the far-field radiation pattern for arbitrarily large antennas.
Very-Near-Field Snapshots
To capture the multiple measurements, a very simple setup is needed. First the antenna under test (AUT) is positioned close to the surface where the very-near-field measurements are to be taken. Figure 1 shows a base station AUT. The antenna is simply suspended over a table in the lab and the very-near-field measurement array is placed in various positions below the antenna to sample the magnetic field radiating in the downward direction. Figure 1a shows the array in the first position at the corner of the desired measurement area. This overall measurement surface is carefully chosen to capture all significant very-near-field radiation under the antenna. In Figure 1b, the array has been moved to the next position such that no gap in the measurement area exists. This move and measurement process continues until the entire scan area has been covered. In this case, five tiles of the 0.40 × 0.40 m measurement array are required.
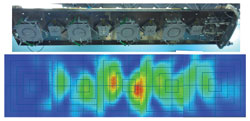
Figure 2 The magnetic very-near-field intensity right below the base station antenna.
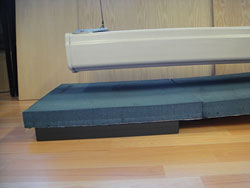
Figure 3 Absorber placed between the measurement array and the antenna under test.
After the separate measurements are combined together, the resulting very-near-field distribution should be almost as if a single large array were used. The combined very-near-fields of the base station antenna are shown in Figure 2. The antenna, with its cover removed, is shown for reference above the field strength plot. In this way, the correlation between the antenna elements and the field hot spots can be seen.
The combined very-near-field plot depicts some pattern distortion at the seams. This is mainly due to the interaction between the measurement array and the AUT not being constant as the measurement array is moved. It will be shown that despite this field distortion, the far-field results are still very accurate. If greater accuracy is required, this effect can be reduced by placing absorbers between the antenna and the measurement array as shown in Figure 3. However, de-embedding the effect of the absorber on the measurement results is not a trivial task.
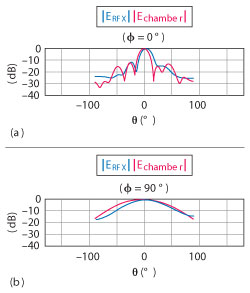
Figure 4 Base station antenna radiation pattern at 700 MHz for elevation (a) and azimuth (b) cuts.
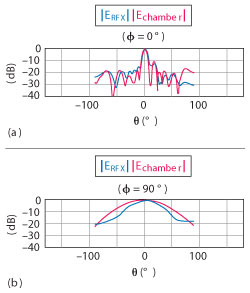
Figure 5 Base station antenna radiation pattern at 1950 MHz for elevation (a) and azimuth (b) cuts.
Transformation to the Far-Field
If the measurement array provides polarized magnetic field measurements with phase information, a simple algorithm can be used for transformation of the measured data to far-field data.4,5 For correct estimation of the far-field radiated power, the mutual coupling effect (loading) of the measurement array needs to be taken into account when doing the transformation.
The far-field radiation pattern of the base station antenna is shown at 700 MHz in Figure 4 and at 1950 MHz in Figure 5. These show a comparison between the pattern calculated from the very-near-field results and the pattern provided by the manufacturer that was measured in an antenna range. The calculated results are labeled as ERFX in this case and show a good correlation with the far-field range results, especially for the main lobe in the elevation cut. This is the narrow lobe at 0° that contains most of the energy in the pattern. In this application, knowing the beamwidth and downtilt is critical. The downtilt is how much off center the peak of the main lobe is.
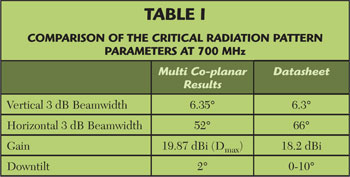
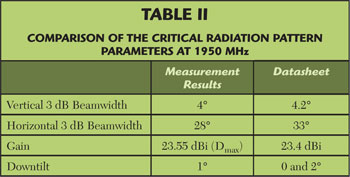
A second set of results is given for a different base station antenna and the beamwidth and downtilt are highlighted (see Tables 1 and 2). The results for the multi co-planar approach show very close agreement in the vertical (elevation) beamwidths as well as downtilt. The horizontal (azimuth) beamwidth could be improved by increasing the number of multi co-planar samples in the horizontal direction.
Conclusion
When measuring the magnetic very-near-field of an antenna, it is fast and easy to obtain accurate estimates of the radiation pattern and power levels. By combining smaller snapshots of the very-near-field, a reasonably sized measurement array can also quickly measure very large antennas in the lab setting and get good estimates of the critical parameters. This solves the very expensive and time consuming problem of measuring arbitrarily large antennas in very large chambers or outdoor ranges.
References
- www.nttdocomo.co.jp/english/binary/pdf/corporate/technology/rd/technical_journal/bn/vol13_4/vol13_4_071en.pdf.
- R. Yamaguch and K. Komiya, “Gain Measurement of Base Station Antenna Using Short Reference Antenna,” Antennas and Propagation (EUCAP), 2012 6th European Conference, pp. 1581-1584.
- R. Patton and N. Yang, “Verifying Very-Near-Field Antenna Measurements: Algorithm Evaluation,” Microwave Journal, April 2013, pp. 94-104.
- R.C. Johnson, H.A. Ecker and J.S. Hollis, “Determination of Far-field Antenna Patterns from Near-field Measurements,” Proceedings of IEEE, Vol. 61, No. 12, December 1973, pp. 1668-1694.
- A.D. Yaghjian, “An Overview of Near-field Antenna Measurements,” IEEE Transactions on Antennas and Propagation, Vol. AP-34, January 1986, pp. 30-45.