
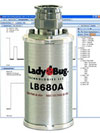
An efficient, accurate and cost-effective method for making RF signal timing and latency measurements is to use wideband video detectors at the two points within the circuit from which the timing comparison is desired. Pulse Profiling USB power sensors from LadyBug Technologies enable easy measurement of one-shot pulse events and other real-time modulated signals with a real-time, wide bandwidth, calibrated analog detector output signal together with a high speed oscilloscope (see Figure 1). This feature (option OW2) is available on LadyBug models LB480A and LB680A.
As an example, the latency of a pulsed signal passing through a CREETM GaN high electron mobility transistor (HEMT) power amplifier for S-Band radar application was measured. The test setup is shown in Figure 2. A pulse signal with a 20 percent duty cycle and a 2.9 GHz carrier frequency was applied to the input through a coupler that was used to provide access to the input signal. The amplifier operates in saturated mode to maximize efficiency and provide fast switching speed for pulsed waveforms. The amplifier supplies 12 dB of gain in its saturated state.
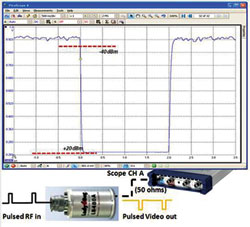
Figure 1 Option OW2 provides a wideband, calibrated analog, negative detector video output signal, 0 to –1 V.
Connecting a LadyBug LB680A power sensor equipped with the wideband video output to both the input and output of the amplifier and the video out of the sensors to two inputs of an oscilloscope enables the time delay measurement (see Figure 3). LadyBug Pulse Profiling software allows temporal measurements of the pulses such as rise and fall times, overshoot, droop and others at both points in the circuit showing the effects of the amplifier on these parameters.
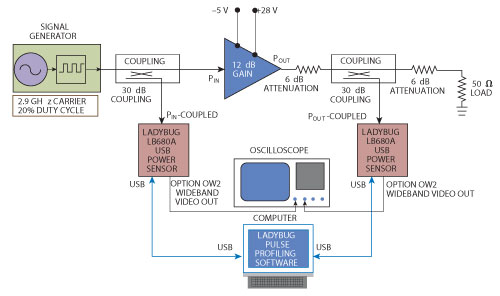
Figure 2 Pulse latency measurement setup.
The latency measurement of the two video outputs on an oscilloscope is shown in Figure 4. With a 2.9 GHz carrier frequency, the average delay measured was 8.37 ns. This was measured at the rising edge of the RF pulse just as the signals began rising. Averaging was used to reduce the effect of random noise.
Additionally, multiple measurements of time delay were made at different carrier frequencies. For this amplifier, the timing latency drops as the carrier frequency increases. At 2.7 GHz, latency is measured as 8.66 ns, falling to 8.14 ns when the frequency is increased to 3.1 GHz.
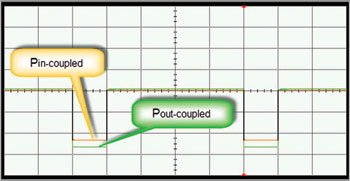
Figure 3 Wideband analog video outputs of the two sensors on an oscilloscope.
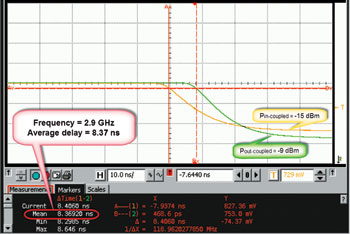
Figure 4 Latency measurement results using an oscilloscope with LadyBug LB680A USB power sensors and option OW2 (multiple measurements of time delay were made at different carrier frequencies).
Time Interval Analysis of Pulses and Pulse Trains
Precise, fast and efficient frequency and time interval analysis (TIA) measurements for a radar system are essential. Pulsed RF signal time and frequency parameters are easily characterized by time stamping the rising and falling RF pulse envelope edges.
For an unmodulated CW pulse, measuring pulse parameters such as pulse repetition interval (PRI) and pulse width (PW) are relatively easy to derive from the spectrum display on a spectrum analyzer. Pulse repetition frequency (PRF = 1/PRI) lines can be obtained by narrowing the resolution bandwidth (RBW) of the spectrum analyzer. Pulse width can be determined by measuring the peak of the spectrum trace to one of the first nulls.
These measurements can be challenging for more complex radar signals. Using the wideband video detector on a LadyBug power sensor with an oscilloscope provides a viable solution. To gather needed information about a long train of pulses with a low duty cycle the oscilloscope or digitizer used will require a substantial amount of memory to acquire a large set of real-time data. Questions include: When does the pulse turn on and off? When does the next pulse turn on and off relative to the previous pulse?
In most radar applications, systems tend to change modes and vary their PW and PRI over time.Without a fast, real-time TIA capability, these mode and timing changes would not be seen.
One answer: measure the timing of the pulse envelope edges provided by the analog envelope signal from the LadyBug power sensor using an oscilloscope or digitizer. Only the timing of the pulse edges needs to be recorded.
For time interval analysis of radar signals, use a wideband video detector and oscilloscope to make measurements and facilitate analysis such as: raw time interval data and frequency vs. time data; RF PW vs. time; RF PRI vs. time; develop PW and PRI histograms and statistics (min/max, mean, standard deviation).
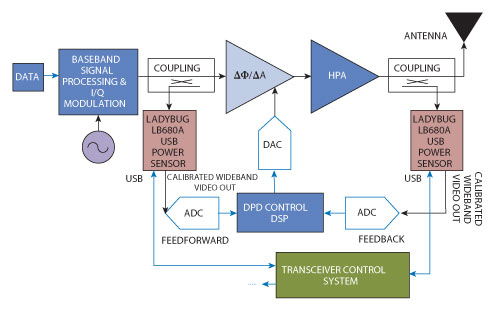
Figure 5 RF Digital predistortion block diagram using signal feed-back and feed-forward.
Simplifying Predistortion Circuitry
System elements affecting the performance of the RF predistortion design are the analog envelope detectors required for generating control signals for the analog or digital control circuitry. One method of simplifying the predistortion circuitry: employ the video detector of a LadyBug peak and average power sensor. This would not be feasible for portable user devices and may not be cost effective for some lower power and lower frequency predistortion applications (L- and S-Band). For higher power fixed applications with the carrier frequencies to 20 GHz, the calibrated video output on the LadyBug power sensor provides a simplifying alternative.
The level of the video output is fully calibrated so the absolute amplitude of the PA output is accurately tracked by the video signal. It can then be sampled and fed to the DSP based digital predistortion circuit without the need to pass through a calibration look-up-table (LUT) reducing the feedback latency.
Figure 5 shows one predistortion configuration out of a multitude of techniques and designs. Here we have implemented digital predistortion using feedback and feed-forward of the analog envelope signals of the RF input and output. Out of all the different possible configurations for PA predistortion, most require at a minimum an accurate real-time sampling of the output power level. The video detector option OW2 is available on LadyBug models LB480A and LB680A pulse profile, peak and average sensors.
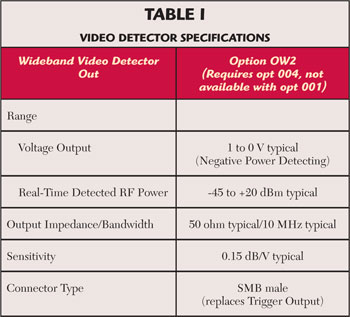
Option OW2 provides real-time, calibrated detector output capability (see Table 1). This allows viewing of one-shot pulses and other real-time modulated signals by using a high speed oscilloscope to display the detector’s analog output. The option OW2 signal is made available on the trigger out (TO) SMB connector (so the TO signal will not be available). Option OW2 requires option 004 and is not available if option 001 is ordered.
LadyBug Technologies,
Santa Rosa, CA
(866) 789-7111,
www.ladybug-tech.com