
As consumers continue to demand more data wirelessly through mobile devices, the increased bandwidth to support these applications has considerable implications on the usage of the RF spectrum. Currently, 75 percent of wireless devices in the U.S. are broadband capable.1 In his keynote speech to the International CTIA Wireless 2012 Conference, FCC Chairman, Julius Genachowski talked of the “looming spectrum crunch” and made the statement that “… it is becoming increasingly harder to find free and clear blocks of spectrum.” Estimates are that between 2010 and 2015, the mobile data traffic will increase at a compound annual growth rate of 92 percent.2 This near insatiable need for more bandwidth drives the requirement for specialized equipment to monitor the RF spectrum.
Spectrum analyzers often come to mind as the receiver solution for making over-the-air spectrum monitoring measurements. Modern RF signal analyzer designs such as the vector signal analyzer (VSA) add useful features for digital signal demodulation. However, since both instruments are optimized for cabled measurements, they are subject to dynamic range limitations in spectrum monitoring applications. For this reason, a specialized receiver optimized for over-the-air measurements should be considered.
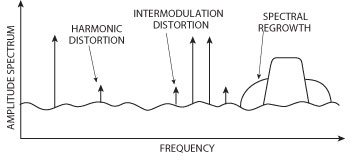
Figure 1 Distortions in the RF spectrum.
Over-the-Air Signal Environment
In many ways, the “over-the-air” signal environment is drastically different from the signal environment of a typical cabled measurement where the number of large amplitude signals is limited and whose frequencies are generally known. A quick scan of the RF spectrum would reveal signal content at a wide range of frequencies, including higher power FM radio around 100 MHz to cellular base stations at frequencies of 900 MHz and beyond. Often, the requirement is to observe a low amplitude signal in the presence of interfering large amplitude signals.
Consider the case when a signal of interest is at a low amplitude level, forcing the operator to increase the receiver gain in order to improve the receiver’s sensitivity. With higher gain, the receiver is more vulnerable to large amplitude interfering tones producing distortion in receiver front end components. If the distortion signal falls on or near a signal of interest, deciphering the distortion signal from the actual signal can be difficult, as shown in Figure 1.
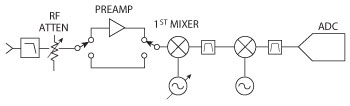
Figure 2 Spectrum analyzer lowband path block diagram.
Especially when analyzing low-power over-the-air signals, both harmonic distortion and intermodulation distortion introduced in nonlinear components of the signal chain can obscure the signal of interest. Harmonic distortion, which results from a single carrier, is generated in the receiver’s first mixer and any nonlinear component in front of the first mixer. Intermodulation distortion (IMD) results from two or more carriers mixing in any nonlinear component. These closely spaced carriers can all progress through the entire receiver chain resulting in IMD from both the RF and IF sections. Spectral regrowth is distortion associated with digitally modulated signals and is a problem when this distortion leaks into adjacent channels.
In addition to distortion masking the signals of interest, broadband noise due to the measurement antenna or the measurement receiver itself can mask the low amplitude signals of interest. Using the receiver’s gain adjustment results in a tradeoff between the receiver’s noise and distortion performance. Simultaneously achieving low distortion and low noise is often a conflicting requirement.
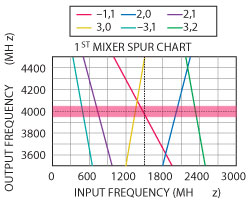
Figure 3 Mixer spur chart.
Measurement Receiver Limitations
Most spectrum analyzers rely on a dual RF path architecture: lowband and highband. The highband path normally uses a YIG Tuned Filter (YTF) as a preselector in front of the rest of the signal chain. However, in the lowband path, below the operating frequency of the YTF, the RF path is most often not preselected. The typical spectrum analyzer’s lowband path is shown in Figure 2.
Mixer spurious responses are governed by:
mfRF + nfLO = fIF (1)
where m,n are integer values representing harmonics of the RF and LO signals. At any given LO frequency, all possible combinations of the harmonics of the RF and LO signals that satisfy Equation 1 will generate an IF response and will be visible on the receiver’s display.
A graphical representation of the mixer spur equation is shown in the spur chart. Figure 3 shows the mixer spur chart for a typical spectrum analyzer lowband path. The x-axis represents the RF port signal frequency and the y-axis represents the IF port frequency. In this example, the spectrum analyzer is tuned to a frequency of 1.5 GHz with an IF of 4 GHz. The LO frequency needed to support this configuration is 5.5 GHz.
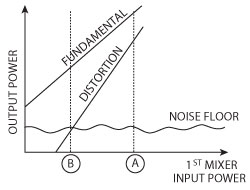
Figure 4 Power out vs. power in for receiver fundamental and distortion tones.
The m = -1, n = 1 response is the desired mixing product. An RF signal present at the tune frequency of 1.5 GHz will produce the wanted displayed response. All other lines on the chart represent spurious responses. When a spur line crosses the horizontal center band, which represents the IF port bandwidth, this signifies that the mfRF and nfLO combination produces an unwanted signal at fIF. Once this undesired signal falls on the IF frequency of the first mixer, the IF signal progresses through the rest of the receiver chain. In this example, if an RF signal is present at 1.33 GHz, the (3,0) mixer spur response generates an unwanted response even though the receiver is tuned to 1.5 GHz. Deciphering a true signal response at 1.5 GHz from the spurious response generated by the 1.33 GHz RF signal becomes a challenge. Because the lowband path of the typical spectrum analyzer normally contains only a single lowpass filter, the first mixer is vulnerable to spurious responses generated by signals whose frequency is anywhere within the lowband frequency range.
Another form of spurious responses is due to intermodulation distortion resulting from two or more signals present at the input of the receiver. If two signals are present at RF frequencies of f1 and f2 then third-order IMD products fall at frequencies of 2 X f2- f1 and 2 X f1- f2. If there is a signal of interest whose frequency is located near one of the distortion products, it is possible to confuse the signal for the receiver-generated distortion product. One technique to minimize the receiver generated distortion amplitudes is to reduce the power levels of the fundamental tones before they reach the first mixer. In the spectrum analyzer, the RF attenuator accomplishes this task. However, reducing the fundamental signal power at the first mixer also decreases the receiver’s sensitivity. Figure 4 illustrates the concept of improved distortion performance at the expense of degraded sensitivity as a function of first mixer power level.
At point ‘A,’ the RF attenuation is relatively low, allowing the high power fundamental tone to reach the first mixer. This results in a relatively high signal-to-noise ratio (SNR) at the expense of relatively large distortion levels. At point ‘B,’ the RF attenuation has been increased to lower the fundamental tone power incident on the first mixer. While this reduces distortion signal amplitude, the consequence is degraded receiver SNR.
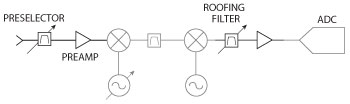
Figure 5 Spectrum monitoring receiver block diagram.
The temptation to overcome degraded receiver sensitivity is to employ a preamplifier that is either part of the spectrum analyzer as shown in Figure 2 or is external to the spectrum analyzer. The improvement in SNR by switching in the preamplifier usually coincides with much worse distortion performance. The end result is worse receiver dynamic range by using the preamplifier over the dynamic range when the preamplifier is bypassed.
Vector signal analyzers are characterized by having IF bandwidths at least as wide as the signal’s modulation bandwidth. Measurements such as error vector magnitude (EVM) require sampling of the entire signal. With a wide bandwidth final IF in the receiver chain, the analog-to-digital converter (ADC) can easily be overdriven by unwanted signals when trying to maximize the SNR. Especially if the low amplitude signal of interest is close in frequency to a stronger interfering signal, the ADC may introduce harmonics and intermodulation distortion products and mask the signal of interest.
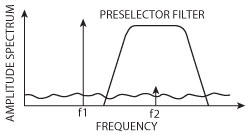
Figure 6 Preselector filter blocks interfering signals.
Additionally, the noise figure of the ADC is normally higher than the noise figure of the front end. Increasing the front end gain is required to minimize the noise impact of the ADC to the overall noise figure of the receiver. With strong interfering tones within the bandwidth of the IF, increasing front end gain to improve receiver sensitivity can lead to additional distortion in the final amplifier stages of the receiver.
Spectrum Monitoring Receiver
The spectrum monitoring receiver builds upon the spectrum analyzer by adding a preselection filter at the RF input and analog IF filters, termed roofing filters, in the final IF. Figure 5 shows where these additional elements are added to the basic spectrum analyzer structure.
The preselector filter can either be a bank of fixed tuned filters or a tunable filter. In either case, the bandwidths of the filters should be less than one octave in order to effectively block harmonics of strong interfering signals. In Figure 6, the signal of interest is located at a frequency of f2. The preselector filter tunes to allow f2 to pass. If a large amplitude interfering signal located at a frequency of f1, such that f1 = f2/2, is present, the preselector filter prevents the receiver’s first mixer from generating 2nd harmonic distortion that would potentially mask the signal of interest.
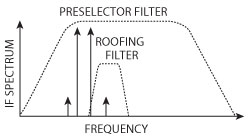
Figure 7 Roofing filter suppresses distortion in final IF stages.
The location of the preamplifier is crucial. It is purposely located after the preselector filter. Preamplifiers require large gain and low noise figure to overcome the noise figure of the down-stream receiver. By locating the preamplifier after the preselector filter, large amplitude interfering signals are attenuated before they reach the preamplifier. The result is both good distortion and good noise figure for the receiver. For this reason, noise performance does not need to be traded off for distortion performance in the spectrum monitoring receiver as it is when using a spectrum analyzer.
At RF frequencies, the low quality factor (Q) of the preselector filters prevents sufficiently narrow enough bandwidth to block all interfering signals. If the signal of interest is located at a frequency close to the interfering signal, both signals can progress through the receiver chain. The roofing filters, located at one of the IF stages, provide further suppression of interfering signals before they can reach the final IF stages or the ADC. These analog filters are a set of fixed frequency bandpass filters whose bandwidths are variable. These filters can either be configured as a bank of filters or a single filter with tunable bandwidth.

Figure 8 FSK modulated signal without roofing filter.
Figure 7 shows how the roofing filter is used in the spectrum monitoring system. In this figure, two large amplitude signals are close enough in frequency that the preselector filter at the RF input cannot remove both tones. The roofing filter, due to operating at a lower frequency has a Q sufficiently large enough to allow for narrow bandwidths. Roofing filters are effective when a signal of interest is located at a frequency that would fall near an IMD product generated by the two large interfering signals. When measuring the weaker signal of interest, the large amplitude interfering signals fall outside the roofing filter bandwidth. With the interfering tones attenuated by the roofing filter, the amplifier stages that follow the roofing filters no longer create significant distortion which allows the gain of these final stages to be increased. Two important results occur: one is that the increased gain helps overcome the noise figure of the ADC and the other is that the higher signal level at the ADC input improves the ADC’s spurious-free dynamic range performance.
PXI Spectrum Monitoring Receiver
As demonstrated here, spectrum monitoring receivers generally apply a few important modifications to the traditional vector signal analyzer architecture to provide sufficient dynamic range performance for over-the-air signals. Especially in PXI, these solutions can be provided simply with “add-on” modules to existing RF signal analyzers. For example, the NI spectrum monitoring receiver (PXIe-5667) was built upon the NI RF vector signal analyzer by using two additional modules: one module contains preselection filters and the other contains the roofing filters.
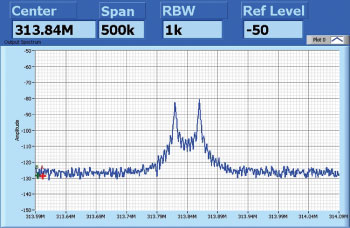
Figure 9 FSK modulated signal with roofing filter.
In addition, the software-defined nature of the spectrum monitoring receiver can be just as important as the hardware. In a typical application, an operator might want to observe just the power and frequency of a tone; or one might want to perform demodulation of the signal. In some cases, the signal is demodulated without any knowledge of the modulation scheme, a process known as blind detection. PXI spectrum monitoring receivers are often used with software such as NI LabVIEW system design software to execute these types of signal processing routines. For more computationally intense signal processing operations, the PXI spectrum monitoring receiver can even be combined with user programmable FPGA modules such as NI FlexRIO. These modules allow the FPGA to be programmed, enabling real-time spectrum monitoring measurements with increased spectrum scanning speeds.
Measurement Examples
1. Roofing Filter Example
Using a spectrum monitoring receiver, the following measurement example shows how the roofing filters improve the receiver’s dynamic range when measuring an FSK modulated signal. A large amplitude interfering signal is injected such that it falls within the bandwidth of the final IF. To view the lower level FSK signal shown at the center of the spectrum in Figure 8, the receiver gain must be increased. This causes the final IF amplifiers and the ADC at the end of the IF chain to distort. This distortion manifests itself as a CW spur and with the FSK signal being mirrored about the CW spur. A user would not be able to decipher the true FSK signal and the receiver-generated distortion product from Figure 8.
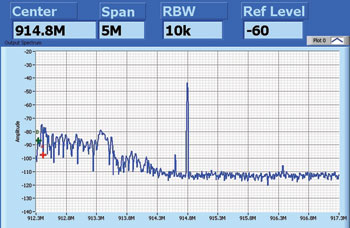
Figure 10 Second harmonic distortion with preselector bypassed.
In Figure 9, a roofing filter has been selected such that the large amplitude interfering signal is blocked from progressing on to the final IF stages and the ADC. The result is improved receiver distortion performance. The true FSK signal can now clearly be seen.
2. Preselector Filter Example
In this example, a large amplitude signal whose frequency is at one-half the center frequency of the spectrum monitoring receiver is injected. When the preselector module is bypassed, as shown in Figure 10, the second harmonic generated in the receiver is clearly visible above the level of other signals in the ISM band.
In Figure 11, the preselector module is included in the receiver chain. The receiver-generated second harmonic is now greatly suppressed, allowing the other signals in the ISM band to be clearly separated from the receiver distortion products.
Conclusion
Over-the-air measurements of the RF spectrum are subject to unknown and unwanted interfering signals. As we have seen, traditional receiver architectures that feature a wide bandwidth RF section as well as a wide bandwidth IF section are prone to receiver-generated distortion that could mask the signal of interest. Also, simply lowering the receiver gain to improve receiver distortion performance can adversely affect the receiver’s sensitivity performance. A spectrum monitoring receiver, on the other hand, is uniquely designed to analyze over-the-air signals. By combining strategic preamplification and filtering at both the RF and the IF, a spectrum monitoring receiver provides maximum dynamic range when measuring a low level signal even in the presence of large interferes.
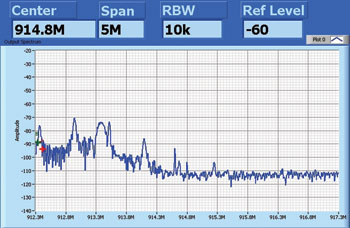
Figure 11 Second harmonic distortion with preselector module included.
References
- www.4gamericas.org, “4G Americas Report Addresses the Impact of Applications, Devices and End User Behavior on Mobile Network Congestion”, May 15, 2012.
- “Repurpose Spectrum For Wireless Broadband Use,” Microwaves and RF, May 2011, ED Online ID #23501.