
The demands placed on modern communications systems for transmitting wideband signals at high quality are growing in both the civil and military sectors. The performance of such systems crucially depends on achieving constant magnitude and linear phase versus frequency of the transmission coefficient within the useful band. Measuring the phase linearity and the group delay of such systems is vital. This applies in particular to microwave communications systems that include components such as satellites or satellite base stations. With systems of this kind, a baseband signal of large bandwidth is up-converted to a high frequency signal at the transmitter end, and the high frequency signal is down-converted to the baseband at the receiver end. Applications like this require group delay to be measured even on frequency-converting devices.
Relative group delay can be determined using the reference mixer method. This measurement method, however, requires access to the mixer's local oscillator (LO) or at least to a reference frequency. Given that numerous aerospace and defense applications do not allow access to either, a different approach is needed. In addition, the reference mixer method reaches its limits when used to perform free-space measurements on transmission systems. With this method, a system's input and output are connected to a network analyzer via RF cables. If distances of more than a hundred meters have to be bridged, cable losses will deteriorate the signal-to-noise ratio (SNR) significantly.
To solve this problem, a new, two-tone method has been developed that allows users to measure relative group delay on converters and mixers with high precision. This method requires no access to the local oscillator or a reference signal, and places only modest requirements on the frequency and phase stability of the local oscillator(s) involved. The method also enables group delay measurements on a transmission system by means of two network analyzers spaced apart from each other. This eliminates the need for RF cable connections, avoiding the typical problems resulting from the use of long cables.

Figure 1 Example of a transmitted and received signal.
Transmission Quality
For correct information transmission, the signal shape at the transmission system output must be identical to the shape at its input. The amplitudes of the output and the input signal may differ, as the signal may undergo amplification or attenuation to match its amplitude to the conditions prevailing at the receiver end. Also, there is no impact on signal quality if the signal arrives at the receiver with a delay. However, for correct transmission all frequency components within a transmission channel or the transmission bandwidth must undergo identical attenuation or amplification and have an identical delay, relative to the input signal. Figure 1 offers an example of a transmitted and received signal.
For two signals with the frequencies ω1 and ω2 to have an identical delay within a transmission channel, the following must be fulfilled:

To obtain a constant delay for all frequencies, the phase of the transmission coefficient S21 must be a linear function of frequency. Starting from equation (1), changing the unit of Δφ from radians to degrees, substituting Δω with 2πΔf and reducing the step size to infinitesimal values, the following relationship is obtained:

The delay, τ, is referred to as the group delay, which is defined as the negative derivative of the phase versus frequency.1 For a transmission channel to be distortion-free, its transmission coefficient, S21, must have constant magnitude and linear phase versus frequency. By contrast, the absolute values of phase and phase slope versus frequency (the latter can be expressed as the group delay) do not impact transmission quality.
S-Parameters
Rather than determining the derivative of the phase (S21) versus frequency, which is based on infinitesimal deltas, vector network analyzers calculate the difference quotient.

This yields a good approximation of the required group delay. Δf is referred to as frequency aperture. From Figure 2 Δφ = φ2 - φ1 and Δf = f2 - f1 are used for calculating group delay.

Figure 2 The terms Δφ = φ2 - φ1 and Δf = f2 - f1 for calculating group delay.
Determining the group delay based on the phase measurement of S-parameters delivers precise results as the measurement accuracy of the network analyzer is very high and can be increased further by applying suitable calibration methods. This approach is ideal for non-frequency-converting DUTs, such as amplifiers and filters.
However, in the case of frequency-converting DUTs such as satellite base station converters, the phase of the transmission coefficient S21 cannot be measured directly because the input and the output signal have different frequencies. Moreover, the phase of the output signal is influenced, not only by the DUT, but also by the frequency and phase drift of its local oscillator.

Figure 3 Test setup for mixer measurements using the reference mixer method.
Reference mixer method
Phase and group delay measurements on mixers with an accessible LO are performed using the reference mixer method.2 The reference mixer uses the LO of the mixer under test in order to convert the reference signal from the network analyzer to the frequency of the IF signal output by the mixer under test. Sharing the same LO compensates for the effects of frequency and phase fluctuations of the LO of the mixer under test. Figure 3 shows a test setup for mixer measurements using the reference mixer method.
The measurement yields the mixer's phase and group delay relative to a reference mixer that was used in place of the mixer under test in order to calibrate the test setup. The reference mixer is often assumed to have ideal characteristics, so the phase and group delay of the mixer under test are measured relative to the reference mixer. With many mixers, the assumption that they have ideal characteristics is justified, as they exhibit a group delay variation of less than 1 ns, which corresponds to a rather linear phase versus frequency.
As has been mentioned, correct information transmission does not depend on absolute group delay, but on the deviation of the group delay from a constant value within the relevant frequency range. The reference mixer method is, therefore, sufficient in most cases. However, this measurement technique cannot be used with DUTs whose LO cannot be accessed.
One possible approach in such cases would be to provide the reference mixer LO by means of an external generator, and set the LO's frequency as closely as possible to that of the DUT's internal LO. In most cases, though, this approach does not yield sufficiently stable results. However, the new two-tone method delivers reliable results, regardless of the stability of the DUT's LO.
The two-tone method
This method stimulates the DUT with a two-tone signal, whereby the network analyzer measures the phase difference between the two carriers, both at the input and the output of the DUT. From the resulting phase differences and the carrier frequency offset, the analyzer calculates the group delay in the same way as in the classic S-parameter measurement.

Figure 4 Group-delay measurement using the two-tone method.
Figure 4 illustrates group delay measurement using the two-tone method. The frequency offset, Δf, between the two carriers corresponds to the frequency aperture in S-parameter measurement.

To measure the phase between two signals with different frequencies, the signal is down-converted to the IF and digitized. In the digital signaling processing (DSP) stage, the signal is down-converted to DC by means of a numerically controlled oscillator (NCO) and filtered. For the two-tone method, each receiver of the network analyzer requires two digital mixer and filter stages with two independent NCOs. This allows the magnitude and phase relationships of two carrier signals to be determined simultaneously in each receiver and used to calculate the group delay. This is shown in Figure 5.

Figure 5 Digital front-end with two digital downconversion stages.
The signal paths within the network analyzer contribute to the measured group delay. This effect can be removed by a calibration that is based on a mixer with known group delay.
The two-tone method is particularly suitable for measurements on frequency-converting DUTs because the frequency and phase fluctuations of the DUT's internal LO cancel each other out when the phase differences between the carriers are determined. In addition to group delay, the relative phase as well as deviation from linear phase can be calculated by integrating the group delay and the derivative of the group delay by differentiating it. Together with scalar conversion loss, this method delivers all parameters necessary to characterize a DUT to determine transmission quality.

Figure 6 Block diagram of test setup for group delay measurement using the two-tone method.
Test setup
To obtain accurate results, the two-tone signal must be generated with a defined frequency offset. The ideal approach is to use the two internal sources of a four-port network analyzer. This ensures an identical frequency offset between the two RF carriers of the two-tone stimulating signal and the two digital oscillators (NCO). Using one of the network analyzer's couplers, the two carriers are combined into a two-tone signal and fed back into the source path. The reference receiver measures the phase difference between the two input signals, which are then applied to the DUT. The DUT output signals are measured by the receivers at port 2 (see Figure 6).
Measuring using two VNAs at separate locations
If the input and output of a transmission system are located far apart (as in free-space measurements), the group delay and phase are very difficult to measure. Long cables are required to transport the RF signals from the DUT to the network analyzer, but they can result in significant losses, deteriorating the signal-to-noise ratio. In addition, phase errors will occur when the cables are moved as they have only limited phase stability.
These difficulties are avoided by measuring the group delay and relative phase using the two-tone method with two spatially separated network analyzers, which both need to be aware of the precise frequency offset of the two-tone signal. The frequencies of the two NCOs are then set accordingly and the individual frequency points read synchronously by the two analyzers. This solution makes it possible to measure the magnitude, group delay and phase of the transmission coefficient without a coaxial connection. All that is required is a common reference frequency for the two network analyzers, which can be provided by means of radio-based modules, for example.
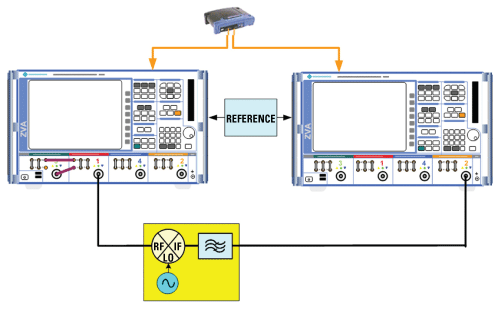
Figure 7 Test setup with two network analyzers installed at separate locations.
Figure 7 shows such a test setup where one network analyzer acts as a master, the other one as a slave. The master controls the slave via a LAN connection and processes and displays results. The two analyzers communicate with each other using LAN messages in line with the LXI standard. They are connected to one another via a LAN router with an integrated DHCP server that assigns the IP addresses to the devices. Alternatively, the devices can use fixed IP addresses. The two analyzers can communicate over a distance of 2 × 100 meters. This is the maximum possible length of a LAN segment. For larger distances, a WLAN connection can be used.
In operation, the master generates the two-tone signal to be applied to the DUT and measures the phase difference between the two signals at the DUT input. It sets the receiver of the slave to the DUT's output frequency. In the case of a frequency-converting DUT, the output frequency differs from the input frequency. The slave measures the phase difference between the two carriers at the DUT output and sends the data to the master, which calculates the conversion loss and the group delay from the data received. This procedure is repeated for each frequency point.
The master sets the two-tone signal and its own receiver to the frequency to be measured, and also sets the slave to the corresponding frequency. This test setup can be used to measure the conversion loss magnitude as well as the absolute and relative group delay.
After installation, the analyzers are connected to the LAN/LXI network and to a common reference frequency. The master displays the magnitude and the relative group delay of the transmission coefficient. If the analyzers are switched off after calibration, the displayed group delay will be shifted by a constant value relative to the actual group delay. If the analyzers remain switched on and connected to the reference frequency between the calibration and the measurement, the master will also display the correct absolute group delay.
As has been mentioned, constant magnitude and group delay of the transmission coefficient are crucial to correct information transmission, whereas the absolute values of these quantities are not relevant to transmission quality. It is, therefore, sufficient to calibrate the master and slave together once before they are installed at their respective sites.
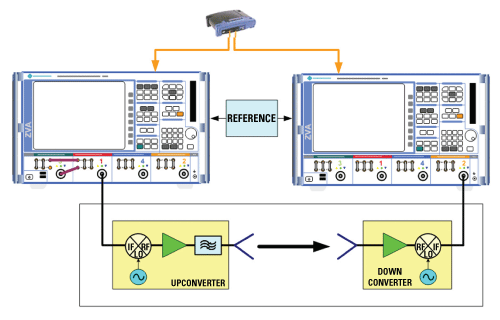
Figure 8 Test setup for measuring group delay and conversion loss on a microwave link.
Measuring a microwave link
The following example describes the process of measuring a microwave link based on an up-converter and a down-converter with inaccessible internal LOs. The input frequencies are different from the output frequencies. The magnitude of the conversion loss and the relative group delay are to be measured. Figure 8 shows the test setup.

Figure 9 Relative group delay (a) and conversion loss (b) measured on a microwave link.
For this application, it is sufficient to measure relative group delay, or group delay deviation from a constant value, respectively. This means that a mixer with a constant group delay is sufficient for calibration. The LO of the calibration mixer offsets the input frequency relative to the output frequency by the same delta as the DUT does during signal up-conversion and down-conversion. For applications with identical input and output frequencies, a non-frequency-converting through connection is sufficient for calibration. Figure 9 shows the relative group delay and the conversion loss.

Figure 10 Relative group delay (a) and conversion loss (b) after increasing the distance between the transmitter and the receiver by one meter.
In a subsequent measurement, the distance between the transmit and receive antenna is increased by about one meter. Figure 10 shows that the relative group delay, or group delay response, remains the same, which was to be expected. The absolute group delay, however, increases by 3.3 nanoseconds, which corresponds approximately to the electrical length of one meter.
Summary
The two-tone signal method is ideal for measuring group delay on frequency-converting devices that do not allow access to their internal LO. It accommodates measurements on test ports spaced a large distance apart, requiring two vector network analyzers; a coaxial connection between the two analyzers is not needed and the analyzers communicate with each other via a LAN/LXI interface.
References
- Michael Hiebel, "Fundamentals of Network Analysis," Rohde & Schwarz, March 2007, ISBN: 10 3939837067
- Dr. Olaf Ostwald, "Group and Phase Delay Measurements with Vector Network Analyzer ZVR," Rohde & Schwarz Application Note 1EZ35_1E, July 1997.
Thilo Bednorz studied communications and RF engineering at the Technical University of Munich. He is Product Manager for network analysis at Rohde & Schwarz GmbH & Co. KG.
Jochen Wolle studied electrical engineering at the Technical Universities of Darmstadt and Munich. He is head of software development for spectrum and network analyzers, oscilloscopes and EMI test receivers at Rohde & Schwarz GmbH & Co. KG. He also represents the company on the Board of Directors of the IVI Foundation and LXI Consortium and is Chairman of the LXI Conformance Committee.