
Whether imaging an asteroid at a range of 55 million miles (88 million km), guiding a strategic defense missile to its target with a monopulse tracking radar or launching a rocket propelled grenade in the blink of an eye as a counter-measure, it is easy to see how radar technology has progressed significantly in recent years. Today’s advanced radars perform their amazing feats using intricate signals and advanced signal processing. Unfortunately, the complexity of modern radars can present significant test and diagnostic challenges.
Most radar systems transmit RF pulses and listen between transmissions for reflected signals. The shape, duty cycle and amplitude of the transmitted RF pulses determine important system parameters like detection range and minimum target resolution. To validate the system performance, analyses are required in both time domain, for shape and duty cycle, as well as in the frequency domain, for carrier frequency and bandwidth.
Complicating matters further, many radars use pulse compression techniques to improve range and resolution. By modulating the transmitted pulse, it is possible to separate received echoes that overlap in time and would not otherwise be resolved into individual targets. Initially, simple modulations such as an FM chirp (linear FM sweep) were used. Now, compression techniques also include a variety of phase modulations. Troubleshooting these modulated pulses presents additional test equipment demands. Compressed pulses require not only time and frequency analyses, but also modulation domain analysis. FM ramp linearity, bi-phase coding and many other modulation parameters become important metrics.
As if these test requirements were not enough, some sophisticated military radars must perform in complex spectral environments. Military radars are required to function correctly when subjected to a barrage of adjacent channel communications signals, disruptive noise jamming and intentionally deceptive jamming pulses. Capturing the intermittent radar pulse against a background of potential interferers demands outstanding RF triggering. This can be particularly difficult to accomplish under real-world operating conditions. Spectrally dense electronic warfare (EW) environments may contain jamming signals that are larger than the radar echo of interest. Triggering on the weaker intermittent radar pulse can present a tough problem for the test engineer.
Pulse Characteristics and Their Effect on Radar Performance

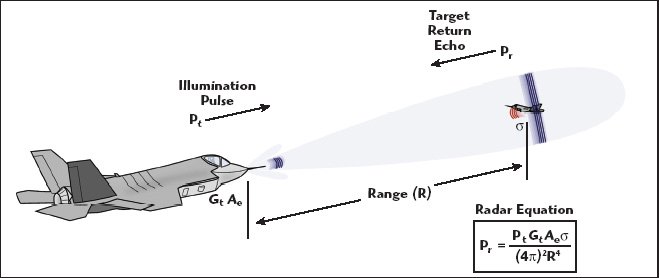
Radars typically illuminate their targets with an RF pulse and then listen for the return echo. Since the RF pulse propagates at the speed of light, the time it takes for the echo to return is proportional to the distance between the source and the target. This, of course, applies to a primary-radar, one that relies on reflected energy bouncing back off the target. Secondary-radars that re-transmit the signal back from a transponder have additional delays.
The RF pulse characteristics determine a great deal about the radar’s capability. EW and electronic intelligence (ELINT) experts specialize in the study of these pulsed signals. The pulse characteristics provide valuable information about the type of radar that sent the signal and what it might be attached to — a sailboat, battleship, passenger plane, bomber or missile, for example. The commonly used radar pulse characteristics are shown in Figure 1. The pulse repetition interval (PRI) is the time the pulse cycle takes before repeating. It is equal to the reciprocal of the pulse repetition frequency (PRF) or pulse repetition rate (PRR), the number of transmitted pulses per second. PRI is important because it can limit the maximum unambiguous range or distance the radar can operate over. The pulse-off time may actually be a better indication of the radar system’s maximum design range. Most radar systems employ a transmit/receive (T/R) switch to allow the transmitter and receiver to share a single antenna. The transmitter and receiver take turns using the antenna. The transmitter sends out pulses and during the off-time the receiver listens for the echo. The pulse-off time is the period the receiver can listen for the reflected echo. The longer the off-time, the farther away the target can be without the return delay putting the received pulse after the next transmitted pulse. This would incorrectly make the target appear to be reflected from a nearby object. To avoid this ambiguity, most radars simply use a pulse-off time that is long enough to make the echoes from a target at the farthest possible range to be still within the off-time and not overlap into the subsequent pulse’s off-time.
Another consideration for the maximum range of the radar is the transmitted power. Peak power is a measure of the maximum instantaneous power level in the pulse. Power droop, pulse top amplitude and overshoot are also of interest. ELINT experts sometimes scrutinize these characteristics, as they can provide additional information about the radar’s qualities.
The pulse amplitude (power) and pulse width are important for calculating the total energy in a given pulse (power x time). Knowing the duty cycle, the ratio between the pulse width and the pulse repetition interval, and the power of a given pulse, the average RF power transmitted can be calculated (power x duty cycle). Unlike communications systems, radar systems suffer from very large signal path losses. The round trip distance is twice that of a communications link, and there are losses associated with the radar cross-section and the reflectivity of the target.
The radar equation shown in Figure 2 relates the received power (Pr) to the transmitted pulse power (Pt), based on the antenna gain (Gt) and area (Ae), the target cross-section (?) and the range distance (R). The range term is raised to the fourth power in the denominator, underscoring the tremendous losses the radar signal undergoes. There are several other forms of the radar equation that take into account differing applications and antenna configurations.

Using the radar equation, the received signal level can be calculated to determine if sufficient power exists to detect the radar pulse. Combining multiple pulses to accumulate greater signal power and average out the noise is also helpful for increasing the detection range. The pulse width is a particularly important radar signal property. The wider the pulse, the greater the energy contained within the pulse for a given amplitude. The greater the transmitted pulse power, the greater the reception range capability of the radar. A greater pulse width also increases the average transmitted power. This makes the transmitter work harder. The difference (in dB) between the average and the peak transmitted power levels is given by 10 times the logarithm of the duty cycle. The range is therefore limited by the pulse characteristics, the propagation losses and the target cross-section. The PRI and duty cycle set the maximum allowed time for a return echo, while the power or energy in the return signal must overcome the background noise at the receiver input.
The pulse width also affects the radar’s minimum resolution, as shown in Figure 3. Echoes from long pulses can overlap in time, making it impossible to determine the nature of the target or targets. A long transmitted pulse will produce a long received pulse. A long return pulse can result from a long transmit pulse if reflected from a single target or from the reflection of a tight formation of multiple targets composed of several long reflections that overlap. Without sufficient resolution, it is impossible to determine the number of objects that actually make up the echo return. A narrow pulse width avoids overlapping echoes and improves the resolution. Pulse width thus affects two very important radar system capabilities — resolution and detection range. Unfortunately, these two qualities are traded off against each other. Wider pulses equate to longer-range radars with less resolution, whereas narrower pulses equate to finer resolution but shorter range. Narrow pulses also require greater bandwidth to be produced and received correctly. This makes the pulse’s spectral nature another point of interest.
The time domain characteristics of the pulse naturally have their frequency domain equivalents. A narrow pulse width has a broader spectral shape than a wider pulse. Similarly, a higher pulse repetition frequency will have larger spaces between the spectral line components than a slow PRF.
Pulse Radar Test and Analysis Approaches
To truly understand the system performance and troubleshoot today’s complex radar signals, the time, frequency and modulation domains all require analysis in a time-correlated fashion. Traditionally, no single test instrument was designed for this breadth of radar pulse analysis capability. Engineers have been forced to use many different test instruments in custom-built test sets to collect sufficient data for reliable troubleshooting. Unfortunately, using multiple test instruments is costly, time-consuming and can introduce measurement uncertainties that can lead to unreliable diagnostics.
Early radar diagnostics were performed primarily with an oscilloscope and RF diode detectors. The oscilloscope’s limited frequency capability relegated its diagnostic applications to baseband waveforms (such as drive voltages to the magnetron tubes). In the 1960s, the swept spectrum analyzer became commercially available to the industry. This provided a convenient means to display the RF spectrum and determine if baseband pulse shapes were correctly translated to microwave frequencies. The swept analyzer’s “Zero-span” (single-frequency operation using the selected bandwidth filter and sweeping the horizontal axis of the CRT in time, just like an oscilloscope) added another way to view the pulse amplitude versus time, and quickly replaced the much cruder diode detector. Employing both oscilloscopes and spectrum analyzers, time and frequency domain analysis of radar signals at baseband and RF was possible.

As pulse compression schemes grew in popularity, engineers needed a third test instrument — the analog modulation analyzer. This instrument provided a means to measure the linearity of the FM pulse compression (chirps). The modulation analyzer was later replaced by the more versatile vector signal analyzer (VSA), which could also analyze digital phase modulation. The VSA is not ideal for modulated pulse measurements, however, since it was initially developed for the continuous quadrature amplitude modulated (QAM) signals used in the telecommunications industry. VSAs typically have a rudimentary IF level-triggering ability unsuited for radar systems that must function in complex spectral environments. Even the latest VSAs lack comprehensive radar pulse analysis software, remaining focused on the consumer communications market. Until recently, this combination of oscilloscope, swept spectrum analyzer and VSA represented the mainstay of affordable, commercially available test equipment for the radar engineer. The only truly comprehensive multi-domain diagnostic solution available was the custom-built test set. Fortunately, the latest generation of real-time spectrum analyzers (RTSA) offers a cost-effective and efficient way to test and troubleshoot complex pulsed radar signals. They are able to trigger on an RF pulse, seamlessly capture it into memory and analyze the pulse in several time-correlated domains on a single instrument. Simplified block diagrams of these analyzers are shown in Figure 4.
The RTSA was initially introduced at approximately the same time the VSA became popular and has always provided superior transient signal analysis capability relative to other test instruments. Its application to radar signal diagnostics was initially limited, however, as early RTSAs were rather expensive and used primarily for applications where national security issues warranted the high cost. As digital signal processing (DSP) technology has improved, the affordability of RTSA technology now falls within reach of even modest budgets and offers a viable alternative to the traditional custom-built test set for complex radars.
RTSA Delivers Real-time Triggering, Seamless Signal Capture and Time-correlated Multi-domain Analysis
The RTSA is fundamentally different in capability from the swept spectrum analyzer and VSA. Leading RTSAs are optimized to deliver real-time triggering, seamless signal capture and time-correlated multi-domain analysis. Their architecture and software are ideal for transient RF signals, including radar pulses. Unlike swept tuned analyzers and VSAs, the RTSA can process time domain data into the frequency domain in real-time. This allows the RTSA to continuously analyze its input spectrum by taking super fast, real-time fast Fourier transforms (FFT) of the input signal prior to triggering and capturing data. Conversely, other analyzers randomly capture the data or trigger on IF levels and then analyze what has been captured off-line, leaving large portions of the signal unanalyzed between sweeps or captures. The RTSA’s ability to continuously analyze the signal and trigger to capture only on frequency events of interest is ideal for many radar applications.
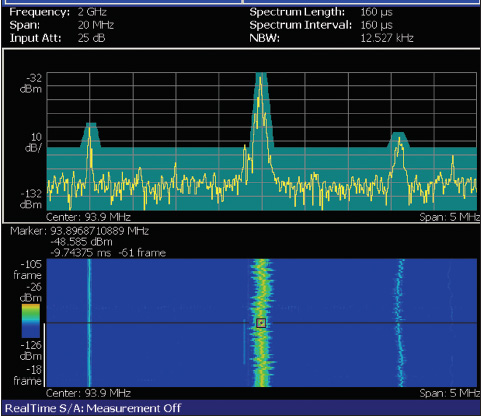
Today’s top RTSAs feature a unique frequency mask trigger (FMT), which can capture a spectrally interesting event, such as a weak radar pulse, under complex spectral conditions where other analyzers would fail. For example, a radar transmitter contains a large spurious CW leakage along with the desired pulses. This makes conventional IF level triggering useless when taken directly after the down-conversion mixer. The RTSA’s FMT can easily be set to ignore the CW leakage and trigger on the much weaker pulse event (see Figure 5). Similarly, capturing weak echo returns in challenging EW environments is easily accomplished. The RTSA is also a multi-domain instrument capable of displaying time, frequency and modulation domain measurements. This allows the RTSA to replace several traditional instruments with a single portable unit. Since each measurement domain is derived from the same time synchronized record, measurements are precisely time-correlated. The operator can place a marker on a spectral or modulation anomaly and correlate it with the exact pulse that produced it. Time-correlated displays greatly enhance the diagnostic insight and reliability by providing a critical causality component. Traditionally, such precise time-correlated displays between separate instruments were difficult to obtain, requiring synchronization of multiple instruments.
Capturing Radar Signals
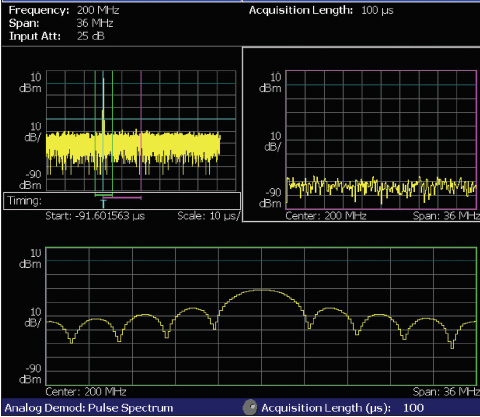
Before signal analysis and diagnostics can begin, it is necessary to capture a recording of the signal of interest. The combination of comprehensive pulse measurement software, FMT and DSP hardware enable advanced RTSAs to convert time domain waveform samples into the frequency domain in real-time. The FMT can reliably capture elusive radar pulses or frequency abnormalities embedded in complex EW or real-world spectral backgrounds. The procedure for capturing pulse events of interest begins with setting up a frequency mask trigger. Complex frequency masks can be stretched around signals of no interest with a few mouse clicks, and the mask can be set just above the noise floor to avoid false triggers. Once the frequency mask is set up, any spectral event of interest that falls outside the mask will trigger a capture. In radar work, transient pulse returns are often well below the signal level of other nearby spectral emissions. This makes IF level triggering unreliable. The FMT, however, can compare the input signal’s spectrum in real-time to the trigger mask, detecting even weak signal anomalies. Reliably finding the pulse is important, but once found there are other issues that can affect the display clarity and the accuracy of the captured data. Some modern RTSAs digitize the entire IF with a fast sampling analog-to-digital converter (ADC). These analyzers can seamlessly capture signals that require 36 MHz of spectral bandwidth and, with filters optimized for time domain measurements, can provide exceptional resolution — up to 20 ns on select RTSAs. This enables analysis of very narrow pulses and provides good detail of pulse shape (see Figure 6). The time samples of the input signal taken by the analyzer are at a rate of at least twice the frequency of interest (Nyquist rate) or greater to avoid signal alias effects. The time samples are grouped into frames of data. Each frame contains the exact integer set of data necessary for the FFT process.
The fact that the data samples at each end of the frame do not continue beyond the frame, as they did with the original time samples before the frame was created, will artificially create an abrupt discontinuity. This discontinuity will cause spectral spreading when transformed from the time domain to the frequency domain. The frame itself is effectively now a “pulse.” To minimize the effect of this discontinuity, a windowing function is used to scale the amplitude of the time-sampled data, reducing the amplitude of the samples on each end of the frame to zero. RTSAs generally offer a variety of popular windowing functions such as the Hanning, Hamming, Blackman, Blackman/Harris, Parzen, Welch and others. After the frame’s data has been scaled by the windowing function, the FFT is calculated, transforming the data from amplitude versus time to amplitude versus frequency. The FFT requires a variety of data computations to determine the amplitude of each frequency segment or “bucket.” The FFT process assumes a continuous signal across the frame of data. Discontinuities or pulses that are shorter than one frame length can create errors in the amplitude of the spectral display. Signals with durations shorter than the full-frame length will be displayed with an amplitude that is proportionately lower than signals that occupy the entire frame. This presents a problem when analyzing radar pulses. Even worse, short pulses at the very end of the FFT frame suffer from additional reductions in amplitude or complete elimination by the windowing function. These effects can lead to significant measurement errors.1 With pulsed signals, the most accurate FFT results are obtained when the pulse is centered in the data frame and the length is roughly the same as the frame. In effect, this makes the pulsed data more like continuous data.
Analyzing Radar Signals
The modern RTSA’s comprehensive pulse measurement software and time-correlated multi-domain displays provide extensive and largely automated radar signal analysis. The measurement software offers a wide variety of automated diagnostics designed for the characterization of radar signals, bringing the same speed and convenience to radar signal analysis that many high volume consumer RF devices have enjoyed for years. It also is less costly than specialized military ELINT pulse analyzers.
In conjunction with the time-correlated multi-domain displays, individual pulse characteristics can be quickly determined. Today’s RTSAs can measure and graphically display pulse width, peak power, on/off ratio, pulse ripple, PRI, duty cycle, pulse-to-pulse phase, channel power, occupied bandwidth (OBW), effective bandwidth (EBW) and frequency deviation.
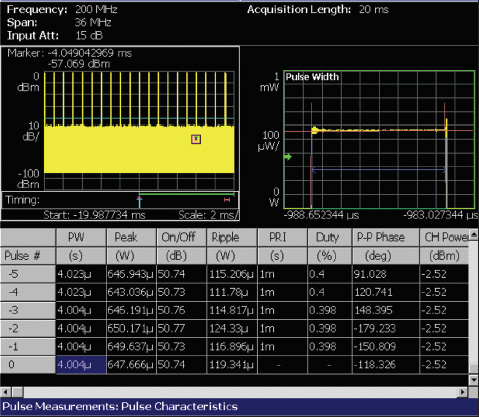
Since more than one pulse may be captured in a single recording, the RTSA has the capability to measure each pulse, assign a number to it and display a table of measurement results automatically (see Figure 7). With time-correlated displays, a pulse can be selected in the measurement table and a corresponding marker in the power versus time display will automatically correlate to it. The pulse will automatically be centered in the FFT window, meaning there will be no distortion of the pulse introduced by the FFT process. The unique software of the RTSA not only provides tabular data for each pulse measurement, but can also provide a graphical view. The graphical displays lend diagnostic insight by revealing trends. For example, as a radar transmitter heats up, its power operation may drift. Using a RTSA, the peak power for each pulse can be displayed graphically, making the power drift trend across multiple pulses easy to spot. Such measurements are not only helpful to the radar system designer and builder, but they can provide valuable information to the ELINT or EW specialist. Detailed signal trend analysis can provide confirmation as to the type of emitter being encountered.
Measuring Multiple Pulses
The RTSA can also be applied to multiple pulse measurements. One such example is the pulse doublet that is commonly used to test radar receiver performance. Two closely spaced pulses (pulse doublet) simulate echo returns from closely spaced target objects. Pulse doublets are great for testing a radar receiver’s resolution ability. Using a signal generator, a variety of pulse doublet patterns and complex EW environments can be created for testing radar receivers. The RTSA is well equipped for validating these pulse doublet patterns and observing degradation caused by the receiver.
An example of diagnostic application using the pulse doublet is measurement of phase change between pulses traveling through a receiver subsystem. Some radar receivers use phase changes to measure the velocity of the target. Moving targets create a Doppler shift in frequency between the transmitted pulse and the received pulse. The Doppler shift can be viewed as an accumulating phase shift between the transmitted signal and the received signal. Periodic measurement of the phase shift between the transmitted and received frequencies is a quick way to determine the relative velocity difference.
Maintaining receiver phase stability with differing echo return amplitude levels is therefore important for precise velocity measurements. Unfortunately, many components in the radar receiver chain can exhibit nonlinear effects, such as amplitude modulation to phase modulation (AM/PM) conversion, which can create unwanted phase shifts based on the amplitude of the echo return. These unwanted phase shifts will be interpreted as velocity errors.

Using the RTSA to determine receiver phase stability is a simple matter. First, the radar receiver is stimulated with a coherent pulse doublet of differing amplitude from a signal generator (see Figure 8). Then the phase difference between the two pulses is observed at the output of the receiver chain. By selecting a phase demodulation display, the RTSA can graphically display the phase of each pulse versus time. The phase difference for static targets should be zero for a wide range of doublet amplitude differences. If phase stability is poor, higher dynamic range components may be required.
Analyzing Pulse Compression
Compressed radar pulses also present measurement challenges. Radar pulse compression is used by many types of radar to improve both range and resolution. There is typically a tradeoff between improving resolution with narrower pulses and increasing range with wider pulses, yet pulse compression techniques can provide an increase in both range and resolution at the same time. By modulating the pulse, return signals that overlap can be separated. Therefore, a wider pulse can be used with greater energy without sacrificing range resolution.
There are many different pulse compression schemes and modulations. Typically, pulse compression is accomplished with either frequency or phase modulation to maintain a more constant pulse amplitude. The most common pulse compression modulation is the FM chirp, where a linear FM frequency ramp is used. In the receiver the FM chirp echoes are passed through a special filter which delays the low frequencies differently than the high frequencies. This has the effect of compressing the pulse or making it narrower in time. Pulses that were wide and overlapping emerge from the filter as distinctly separate pulses. Characterizing the compressed radar pulse adds the challenge of demodulating the pulse. The RTSA’s multi-domain displays can analyze a compressed pulse’s modulation in addition to making the normal pulse measurements. For example, an FM chirped pulse can be viewed in the power versus time domain, FM modulation domain and pulse measurement mode simultaneously. This allows easy inspection of the FM sweep linearity, pulse width, duty cycle and frequency deviation. Diagnostic assessments are further simplified with time-correlated displays. Placing a marker on one pulse will provide corresponding markers in the power versus time and modulation domain displays.
Similarly, the RTSA can analyze stepped frequency changes within a pulse. By viewing FM demodulation, the frequency-hopped steps in a pulse are readily apparent. Even a small amount of ringing can be seen as the phase lock loop transitions to the next frequency. This level of detail makes diagnostics of the pulse generation circuits a straightforward process.
Select RTSAs are also capable of analyzing compressed radar pulses that are phase modulated. The analyzer is simply placed in an analog demodulation mode with phase demodulation selected. In complex spectral environments, a frequency mask trigger is set to capture a recording of the pulse. Once recorded, the RTSA’s demodulator will display the phase versus time, where the individual level transitions can be viewed. This can be important for many modern radar systems that use bi-phase modulation with orthogonal digital encoding to separate overlapping pulses and eliminate range ambiguity problems. In some cases, it is possible to use a selected RTSA’s capability to perform digital modulation analysis on an individual pulse to obtain modulation quality information contained within a given pulse.
Streamlined Testing and Analysis of Complex Radar Signals
Complex radar signal characterizations traditionally require multiple instruments and elaborate test setups. The transient nature of the radar pulse along with modern pulse compression schemes can make signal acquisition and accurate analysis a challenge. The modern RTSA is optimized for these transient RF signals. With unique capabilities such as frequency mask trigger, overlapping FFTs, automatic pulse centering in the frame and spectrogram zoom, the RTSA can reliably capture and display radar pulses even in complex EW spectral environments.
Pulse measurement software available for these instruments provides extensive automatic pulse characterization capability for the radar, EW and ELINT specialist. Automatic measurements streamline setup time and multi-domain displays enhance diagnostic insight, making radar system troubleshooting fast with reliable diagnostic conclusions.
Covering the gamut from simple pulse width measurements to complex demodulation of frequency hopping pulses, today’s RTSA offers a new level of test and measurement capability that effectively replaces several traditional analyzers. Rapid automatic pulse measurements provided by the RTSA enhance the efficiency of product development, production and field maintenance operations.
Reference
1. Understanding FFT Overlap and Processing: A Tektronix Real-time Spectrum Analyzer Primer.
Matthew J. Maxwell received his BSEE degree from the University of Washington, Seattle, WA, in 1995. He served as a US Navy officer aboard nuclear submarines, where he held various positions from communications officer to reactor control officer. Since joining Tektronix as product manager for real-time spectrum analyzers, he has worked with the communications and microwave industries on applications of spectrum analyzers.